• Home
Crypto Gohan
keep your memories alive
Japanese & Asian Crypto Markets

Moscow Exchange Launches Crypto Derivatives Trading for Five Major Assets

by Iffa Jayyana September 18, 2026
written by Iffa Jayyana

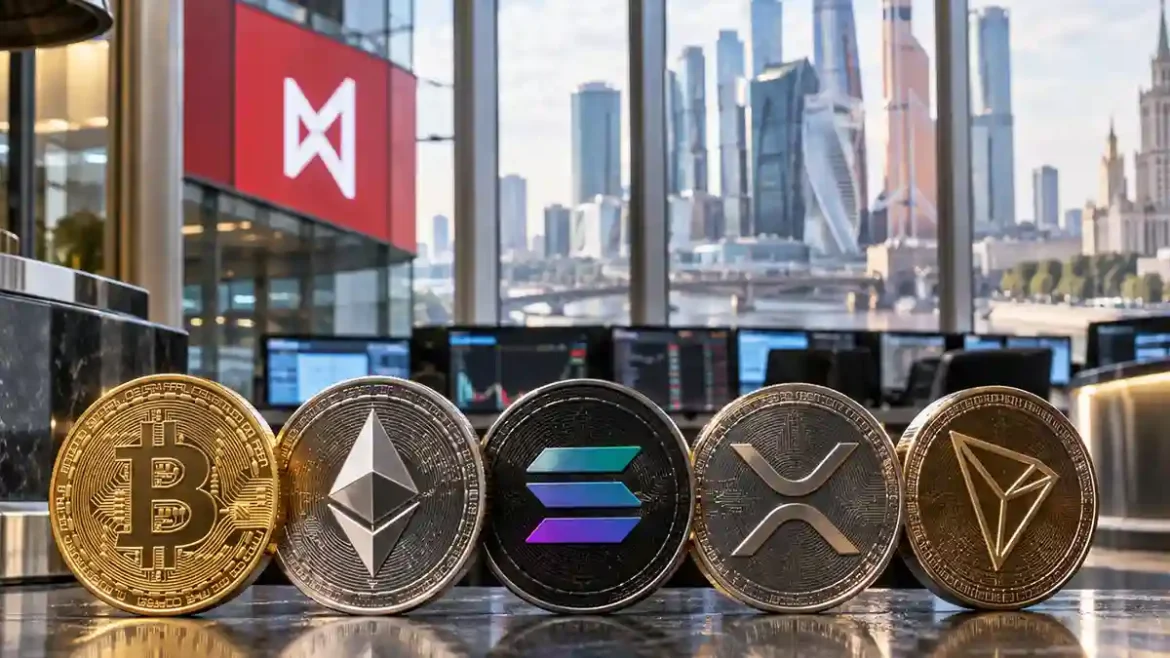
The Moscow Exchange (MOEX), Russia’s largest exchange group, has officially inaugurated a new segment dedicated to the trading of crypto derivatives, marking a significant milestone in the integration of digital assets into the nation’s traditional financial infrastructure. As of September 2026, the exchange has introduced derivative contracts linked to five prominent cryptocurrencies: Bitcoin (BTC), Ethereum (ETH), Solana (SOL), Ripple (XRP), and Tron (TRX). This development represents a calculated effort by the exchange to bridge the gap between institutional finance and the burgeoning digital asset economy, providing market participants with regulated, transparent, and secure instruments for exposure to cryptocurrency price movements.

Strategic Expansion into Digital Assets

The introduction of these derivatives follows months of rigorous internal testing and regulatory scrutiny. MOEX, which has long been the cornerstone of Russian equity and currency trading, is now positioning itself as a central hub for regulated crypto exposure. By offering derivative products, the exchange allows traders to speculate on price changes or hedge existing positions without the technical complexities associated with direct custody of digital tokens.

This move is particularly significant given the global trend of financial institutions seeking to bring digital assets into established regulatory frameworks. For the Moscow Exchange, the focus is on maintaining high standards of market integrity. The new instruments are designed to provide institutional and retail investors with a familiar trading environment, utilizing the same settlement mechanisms and clearing infrastructure that have supported the exchange’s stock and bond markets for years.

Chronology and Implementation Timeline

The rollout of these instruments occurred in phases throughout the third quarter of 2026. The initial announcement was made in mid-September, with the platform becoming fully operational for the public by September 22, 2026. This transition was preceded by a series of pilot programs involving select financial institutions, which tested the liquidity and stability of the clearinghouse systems.

The timeline for the project began in earnest in late 2025, when the exchange management signaled its intention to explore digital asset-linked products. Following the necessary technical infrastructure upgrades, the exchange began a series of soft launches in early 2026, initially focusing on smaller subsets of assets before expanding to the current list of five major cryptocurrencies. The systematic approach ensured that the clearinghouse, which manages the risk and settlement of these derivatives, could handle the volatility inherent in crypto markets without compromising the broader financial system.

Market Data and Instrument Specifications

The crypto derivatives offered by MOEX are structured as cash-settled contracts, meaning that upon the expiration of the contract, the difference between the contract price and the underlying asset’s market value is settled in fiat currency. This eliminates the need for the physical delivery of digital assets, simplifying the process for traditional investors.

Current market data indicates that the exchange has implemented tiered margin requirements, categorized as K1 and K2 levels, to manage systemic risk. For instance, initial margin requirements are adjusted based on the volatility of the underlying asset, with K1 set at 0% and K2 set at approximately 0.35% for certain contracts. These figures are subject to change based on market conditions, and the exchange utilizes real-time monitoring to adjust collateral requirements as needed.

Trading volume has shown a steady upward trajectory since the official launch. Early reports suggest a daily trading volume exceeding 7.2 billion rubles, with contract open interest surpassing 6,000 units (approximately 1.2 billion in underlying value). These figures demonstrate a strong initial appetite among market participants for regulated access to high-volatility assets.

Institutional Integration and Risk Management

A primary concern for the Moscow Exchange throughout this process has been the assurance of transparency and investor protection. To this end, the exchange has integrated these derivatives into its existing risk management framework. Every transaction is cleared through the MOEX clearinghouse, which provides a guarantee of settlement. This is a crucial distinction between the exchange-traded products and the unregulated, decentralized exchanges (DEXs) often found in the crypto space.

The exchange has also implemented stringent know-your-customer (KYC) and anti-money laundering (AML) protocols, ensuring that all participants are properly vetted. By requiring institutional-grade compliance, the exchange aims to attract larger financial players who were previously sidelined by the risks associated with less regulated offshore crypto platforms.

Industry Context and Competitive Landscape

The decision by MOEX to enter the crypto space arrives as other international financial hubs are similarly adjusting their offerings. For example, the Singapore Exchange (SGX) and several other major global entities have also moved toward providing crypto-linked derivatives to meet growing demand. However, MOEX’s approach is distinct in its focus on the specific liquidity needs of the Russian market and its efforts to integrate these assets directly into a national exchange ecosystem.

Industry analysts observe that this move is part of a broader shift in how central exchanges view digital assets. Rather than viewing them as a threat to traditional markets, exchanges like MOEX are treating them as a new asset class that requires formalization. By providing a platform for derivatives, the exchange is effectively commoditizing the underlying assets, making them as accessible as traditional equities.

Implications for Future Market Development

The long-term implications of this move are significant. By offering derivatives on BTC, ETH, SOL, XRP, and TRX, the Moscow Exchange is establishing a pricing benchmark for these assets within the domestic economy. This could lead to further innovations, such as the development of crypto-linked ETFs, mutual funds, or structured products that could be offered to retail investors through traditional banking channels.

Furthermore, the integration of these assets provides a hedge for companies that might be looking to diversify their treasury holdings or manage their exposure to the digital economy. While the current focus remains on derivative contracts, there is speculation that the exchange may eventually move toward providing spot market access or custody services, provided that the regulatory environment continues to favor such integration.

Official Responses and Outlook

Management at the Moscow Exchange has emphasized that the launch of these products is a measured step. They have maintained that the exchange will continue to evaluate the performance of these five assets and may expand the offering to include additional cryptocurrencies if demand persists and market conditions remain stable.

The sentiment among market observers is largely one of cautious optimism. While the volatility of the crypto market remains a challenge, the robust clearing infrastructure provided by MOEX offers a layer of security that is currently absent in many other crypto-trading venues. As the market matures, the role of established financial institutions in managing digital asset exposure is expected to grow, potentially setting a standard for how other jurisdictions approach the regulation and trading of cryptocurrencies.

In summary, the launch of crypto derivatives on the Moscow Exchange represents a maturation of the local financial market. By combining the security of a regulated clearinghouse with the growth potential of digital assets, MOEX is creating a bridge that will likely influence the financial strategies of both institutional and individual investors in the region for years to come. The coming months will be critical in determining whether these initial volume levels can be sustained and whether the exchange will successfully integrate additional digital assets into its portfolio of offerings.


September 18, 2026 0 comment
0 FacebookTwitterPinterestEmail
Japanese & Asian Crypto Markets

Dark Machine Redefines Web3 Competitive Gaming with Multi-Chain Integration, eSports Integration, and High-Performance TPS Mechanics

by Azzam Bilal Chamdy September 18, 2026
written by Azzam Bilal Chamdy

Dark Machine stands at the forefront of the next generation of competitive gaming, merging high-octane third-person shooter (TPS) mechanics with decentralized blockchain infrastructure. Built for PC, iOS, and Android platforms, the title bridges the gap between traditional Web2 eSports enthusiasts and the emerging Web3 economy. By utilizing high-throughput multi-chain architecture on networks such as Immutable zkEVM and Sui, Dark Machine delivers a seamless, low-latency gaming experience designed to support competitive matches ranging from 3v7 formats to large-scale tournament play.

Dark Machineのゲーム性|AAA対戦型シューティングの特徴を解説

Project Overview and Technical Architecture

At its core, Dark Machine is engineered to solve the persistent scalability and latency issues that have historically hindered blockchain-integrated games. Utilizing Immutable zkEVM and the Sui network, the development team has established a robust ecosystem that supports instantaneous asset transfers, secure non-fungible token (NFT) ownership, and transparent player-driven economies.

The game’s native ecosystem token, $MXNA, operates alongside the DEMAX governance framework, providing a balanced dual-token model. This economic structure allows players to earn rewards through competitive play, participate in governance decisions, and trade in-game assets securely without encountering the prohibitive gas fees typical of legacy blockchain networks. Furthermore, the integration of Immutable Passport enables simplified onboarding through standard Web2 credentials such as Google and Apple IDs, eliminating friction for mainstream gamers entering the Web3 space.

Dark Machineのゲーム性|AAA対戦型シューティングの特徴を解説

Gameplay Mechanics and TPS Innovation

Dark Machine distinguishes itself within the competitive gaming landscape through fast-paced TPS mechanics that emphasize tactical depth, spatial awareness, and quick-reflex gunplay. Players pilot advanced mech units equipped with customizable loadouts, weapon configurations, and defensive modules. The game’s arena design encourages dynamic team strategies, where positioning and resource management dictate the outcome of high-stakes matches.

Unlike traditional title structures where in-game purchases remain locked within a closed ecosystem, Dark Machine introduces a player-owned economy backed by verifiable digital scarcity. Through the integration of Soulbound Tokens (SBTs) and tradeable NFTs, players retain true ownership of their hard-earned gear, skins, and competitive achievements. This framework not quais-guarantees interoperability across future expansions but also establishes a sustainable secondary market where skilled players can monetize their time and effort.

Dark Machineのゲーム性|AAA対戦型シューティングの特徴を解説

Chronology and Development Milestones

The development of Dark Machine has followed a meticulously planned roadmap designed to ensure technical stability before commercial rollout. Initial concept phases focused on core engine optimization and balancing the complex interplay between shooter mechanics and decentralized asset management.

  • Early Development Phase: Conceptualization of the core TPS gameplay loop and establishment of foundational multi-chain partnerships.
  • Closed Alpha and Beta Testing: Limited-access periods allowing core community members and invited eSports organizations to test server load, network latency, and token utility.
  • Ecosystem Expansion: Integration of Telegram (TON) mini-apps to widen accessibility and engage casual mobile gamers through gamified task systems.
  • Global Launch Phase: Official rollout across PC, iOS, and Android storefronts, supported by cross-play capabilities and global eSports tournaments.

eSports Integration and Industry Partnerships

Dark Machine has positioned itself aggressively within the competitive eSports arena by forging strategic partnerships with prominent gaming guilds and infrastructure providers. Collaborations with organizations such as META-X have solidified the game’s presence in competitive circuits, providing structured tournament frameworks, prize pool backing, and professional league management.

Dark Machineのゲーム性|AAA対戦型シューティングの特徴を解説

By supporting both 1v1 duels and large-scale team competitions, Dark Machine facilitates live broadcasting via platforms like YouTube and Twitch. This focus on spectator-friendly features ensures that matches are easily digestible for viewers, creating a viable pathway for professional players and content creators to build sustainable careers around the franchise. Industry analysts note that these partnerships mirror the professionalization seen in major Web2 titles, signaling a maturation phase for blockchain-enabled competitive gaming.

Economic Model and Tokenomics ($MXNA)

The economic foundation of Dark Machine relies on the $MXNA token and the DEMAX governance framework. Designed to resist inflationary pressures common in early-generation GameFi projects, the tokenomics model introduces deflationary mechanisms tied to in-game utility and marketplace activity.

Dark Machineのゲーム性|AAA対戦型シューティングの特徴を解説
  • Utility: $MXNA is required for participating in elite tournaments, purchasing high-tier mech upgrades, and accessing exclusive seasonal content.
  • Governance: Token holders can vote on game updates, balancing patches, and future roadmap additions through decentralized autonomous organization (DAO) proposals.
  • Staking Rewards: Long-term participants can stake their assets to earn protocol fees and rare NFT drops, aligning player incentives with the long-term growth of the ecosystem.

To facilitate widespread adoption, $MXNA is integrated with major decentralized wallets, including Bitget Wallet, allowing users to execute swaps and manage assets with minimal transaction friction. Comprehensive user guides provided by market aggregators ensure that even newcomers to decentralized finance can navigate the token purchase and staking processes securely.

Strategic Implications and Market Outlook

The launch of Dark Machine represents a significant milestone in the evolution of blockchain gaming. By prioritizing core gameplay quality over speculative tokenomics, the development team has addressed the primary criticism leveled against early Web3 titles—that they functioned more as financial instruments than engaging video games.

Dark Machineのゲーム性|AAA対戦型シューティングの特徴を解説

Industry observers suggest that the game’s success could pave the way for a broader acceptance of blockchain infrastructure within mainstream eSports. By abstracting away the technical complexities of wallet management and transaction signing through tools like Immutable Passport, Dark Machine proves that Web3 technologies can enhance the gaming experience without alienating traditional audiences.

As the project continues to roll out cross-platform support and expand its competitive calendar, market analysts will closely monitor player retention rates and secondary market liquidity as key indicators of the title’s long-term viability. With robust backing from institutional investors, prominent gaming guilds, and a dedicated player base, Dark Machine is well-positioned to shape the future of competitive multiplayer gaming.

September 18, 2026 0 comment
0 FacebookTwitterPinterestEmail
Japanese & Asian Crypto Markets

Cross-Border Fintech LemFi Secures $53 Million Series B Funding as Monthly Transaction Volumes Soar to $1 Billion

by Dwi Wanna September 18, 2026
written by Dwi Wanna

For millions of households across the developing world, cross-border remittances represent far more than simple financial transactions; they constitute a vital economic lifeline. According to comprehensive data published by the World Bank, global remittance inflows into low- and middle-income countries surpassed an unprecedented $669 billion in 2023. In many emerging market economies, these financial transfers now account for a substantial percentage of gross domestic product (GDP), frequently eclipsing foreign direct investment (FDI) to become the single largest source of external foreign exchange.

Despite an influx of modern technology-driven challengers over the past decade, traditional financial institutions and legacy money transfer agents continue to maintain a formidable grip on the global market, retaining over 60 percent of the total market share. Nevertheless, a new wave of nimble, consumer-centric fintech platforms is aggressively chipping away at that dominance. While some early pioneers in the digital remittance space—such as Remitly—have successfully transitioned to public markets via initial public offerings, others like Zepz and Taptap Send remain privately held, fiercely competing for the remaining market share.

Entering this high-stakes landscape is LemFi, a London-headquartered financial services platform specifically engineered to meet the complex financial needs of global immigrant communities. The four-year-old fintech enterprise has officially announced the closure of a $53 million Series B funding round. Led by London-based growth-stage investment firm Highland Europe—which traditionally backs companies demonstrating annualized revenues exceeding €10 million—the round also saw enthusiastic participation from returning investors Left Lane Capital, Palm Drive Capital, and prominent startup accelerator Y Combinator. They were joined by new strategic participants, including Endeavor Catalyst, bringing LemFi’s cumulative venture capital funding to an impressive $85 million.

The Genesis and Rapid Ascent of LemFi

The foundational roots of LemFi trace back to 2020, when co-founders Ridwan Olalere and Rian Cochran established the enterprise. The two financial technology veterans crossed paths while working at OPay, the prominent African fintech unicorn backed by the SoftBank Vision Fund 2. Recognizing the profound friction, high fees, and opaque exchange rates that immigrant communities frequently encountered when moving money across international borders, Olalere and Cochran set out to build a streamlined, multi-currency account ecosystem tailored to the unique profiles of the global diaspora.

Since its commercial inception four years ago, LemFi has achieved explosive growth. The platform currently boasts a robust user base of over 1 million active customers. These users leverage LemFi’s digital multi-currency accounts to seamlessly transfer funds to friends, family members, and business associates across major emerging economic corridors, including Nigeria, Kenya, India, China, Pakistan, and 15 other developing nations.

Rather than relying on legacy correspondent banking networks that introduce unnecessary delays and layer on hidden charges, LemFi has engineered an adaptable, modular technology stack capable of rapidly plugging into disparate local payment schemes and regulatory frameworks. This technological agility has allowed the company to scale its geographic footprint efficiently. Following a recent European expansion strategy, LemFi now actively operates across 27 origin (send-from) markets and 20 destination (send-to) countries.

A Chronology of Strategic Expansion

LemFi’s trajectory from a fledgling startup to a billion-dollar monthly processing powerhouse is marked by calculated milestones and rapid operational execution:

  • 2020: LemFi is officially founded in London by Ridwan Olalere and Rian Cochran, following their tenure at African fintech unicorn OPay.
  • 2021–2022: The platform builds initial traction by serving diaspora communities in North America, facilitating seamless cross-border transfers to key African markets.
  • April 2023: LemFi crosses a major operational milestone, recording over $2 billion in total annual transaction volume for the year, fueled by expanding product offerings and rising consumer adoption.
  • April 2024: The company formally announces its strategic expansion into Asia, unlocking new high-volume corridors to cater to immigrant communities originating from nations such as India, China, and Pakistan.
  • Late 2024: LemFi secures an initial operational foothold in Europe through a strategic partnership with embedded finance provider Modulr, bridging the gap ahead of regulatory licensing.
  • Present Day: The company closes a $53 million Series B funding round led by Highland Europe, bringing its total institutional funding to $85 million and cementing its position as a major player in the global remittance ecosystem.

Conquering the European Market

LemFi’s most recent geographic push centers heavily on the lucrative European market. Last week, the fintech announced a strategic partnership with embedded finance provider Modulr. This calculated alliance enables LemFi to initiate local operations immediately across European jurisdictions while it awaits the final regulatory clearance slated for next month, following its acquisition of a Republic of Ireland-based financial firm.

By establishing a compliant and scalable operational base within the European Union and the United Kingdom, LemFi aims to capture a significant share of the remittance flows generated by Europe’s vast migrant populations. The company’s primary revenue streams are derived transparently from transaction fees and foreign exchange (FX) spreads, positioning it as a cost-effective alternative to traditional wire services and legacy high-street banks.

Despite the inherent regulatory complexities of navigating multiple sovereign jurisdictions simultaneously, LemFi’s leadership remains confident in the company’s structural readiness. “While regulations market by market remain complex and we have more stakeholders to deal with, scaling has become a lot easier for us because we have technology that is adaptable and can easily plug and play to different payment methods and schemes,” CEO Ridwan Olalere noted in an interview. “So, we intend to go to as many markets as we have significant number of immigrants, starting now with Europe this year, which is going to be a big focus for us.”

Mitigating Fraud to Drive Consumer Retention

One of the foundational pillars of LemFi’s rapid market penetration has been its uncompromising approach to security and risk management. Within the global remittance sector, financial fraud remains an existential threat to both service providers and consumers. According to recent industry analytics from Electronic Payments International, individuals who regularly send money across international borders are nearly four times more likely to fall victim to financial fraud and scams compared to domestic-only financial consumers.

Fraudulent activities, chargebacks, and compliance failures inevitably inflate operational overhead for fintech platforms, costs that are typically passed down to everyday consumers in the form of steeper transaction fees and less favorable exchange rates. LemFi has systematically circumvented this industry pitfall by deploying advanced, proprietary fraud-detection algorithms and real-time transaction monitoring systems.

“Fraud can significantly drive up costs. Higher costs often mean passing them on to customers through additional fees. We’ve managed to keep our fraud rate extremely low, allowing us to offer customers the best possible prices,” Olalere explained.

This strict adherence to security, paired with an intuitive, consumer-first user experience, has yielded exceptional customer loyalty metrics. According to company disclosures, approximately 70 percent of LemFi’s earliest foundational customers continue to utilize the platform actively, while an impressive 60 percent of the broader customer base remains active on an annual basis. Furthermore, this high level of user satisfaction has driven robust organic growth through word-of-mouth referrals, allowing LemFi to acquire customers efficiently without incurring unsustainable marketing expenditures.

Explosive Transaction Volumes and Financial Metrics

Investor confidence in LemFi’s business model is heavily anchored in its extraordinary financial momentum. When Olalere detailed the company’s strategic expansion into Asian markets in April 2024, the fintech reported an annualized transaction volume of $2 billion for the preceding year.

In the months since that announcement, those figures have experienced a dramatic acceleration. LemFi is now processing an astonishing $1 billion in monthly payment volume (TPV), effectively matching its entire annual volume from just a year prior within a 30-day window.

Olalere attributes this staggering growth primarily to the rapid adoption of the platform within the newly established Asian remittance corridors. Within its first year of launch, the Asian corridor alone has scaled to generate $160 million in monthly TPV, maintaining a blistering month-on-month growth rate of 30 percent. Over the past two years, the company has successfully doubled its aggregate user base, total revenue, and transaction counts—metrics that proved instrumental in attracting the attention of institutional growth-fund investors during the Series B negotiations, which Olalere noted were successfully finalized in just four months.

Strategic Deployment of New Capital

With $53 million in fresh capital now secured, LemFi’s executive team has laid out a clear blueprint for deployment. The newly acquired funds will be channeled into three core strategic pillars: product diversification, regulatory licensing, and talent acquisition.

  1. Product and Service Extension: LemFi plans to expand its suite of financial products beyond basic cross-border transfers, introducing enhanced multi-currency management tools, localized savings options, and expanded bill-payment capabilities tailored to diaspora families.
  2. Regulatory Scaling and Partnerships: The company will continue to secure direct payment network licenses and deepen its embedded finance partnerships worldwide, ensuring localized, compliant, and frictionless financial service delivery across diverse regulatory environments.
  3. Talent Acquisition and Organizational Growth: To support its next phase of global scaling, LemFi intends to actively recruit top-tier engineering, compliance, product, and operational talent. The firm currently employs a distributed workforce of over 300 professionals stationed across offices in Europe, North America, Africa, and Asia.

Broader Implications for the Global Fintech Landscape

LemFi’s rapid ascent underscores a broader structural transformation within the global financial architecture. As traditional banking institutions scale back their correspondent banking relationships—often driven by stringent anti-money laundering (AML) and know-your-customer (KYC) compliance burdens—millions of underbanked and unbanked individuals in emerging markets risk being financially marginalized.

Technology-forward platforms like LemFi are effectively filling this systemic void by leveraging modern software infrastructure to reduce transaction friction and democratize access to foreign exchange. By combining aggressive fraud prevention with hyper-localized user experiences, these fintech challengers are redefining consumer expectations in markets that have historically been underserved by legacy institutions.

As LemFi deploys its newly secured capital to deepen its footprint across Europe, North America, Africa, and Asia, the competitive dynamics of the $669 billion global remittance market are poised for continued disruption. For the millions of diaspora workers supporting families back home, the emergence of faster, safer, and more affordable financial conduits marks a profound shift toward greater economic inclusion on a global scale.

September 18, 2026 0 comment
0 FacebookTwitterPinterestEmail
Crypto Mining & Infrastructure

Illuminating the Opaque AI Hardware Market Through New Data Transparency Initiatives

by Iffa Jayyana September 18, 2026
written by Iffa Jayyana

The market for artificial intelligence compute hardware has reached a critical stage of maturity characterized by extreme opacity, mirroring the nascent days of the Bitcoin mining industry. For years, major industry players—ranging from enterprise data center operators to individual AI researchers—have struggled to identify the fair market value of high-performance computing (HPC) nodes. Unlike consumer electronics or traditional enterprise servers, which often feature public MSRPs and established retail channels, the market for 8-GPU NVIDIA HGX nodes is defined by private, request-based quoting, shifting reseller asks, and a fragmented secondary market. This lack of centralized price discovery has hindered efficient capital allocation across the sector.

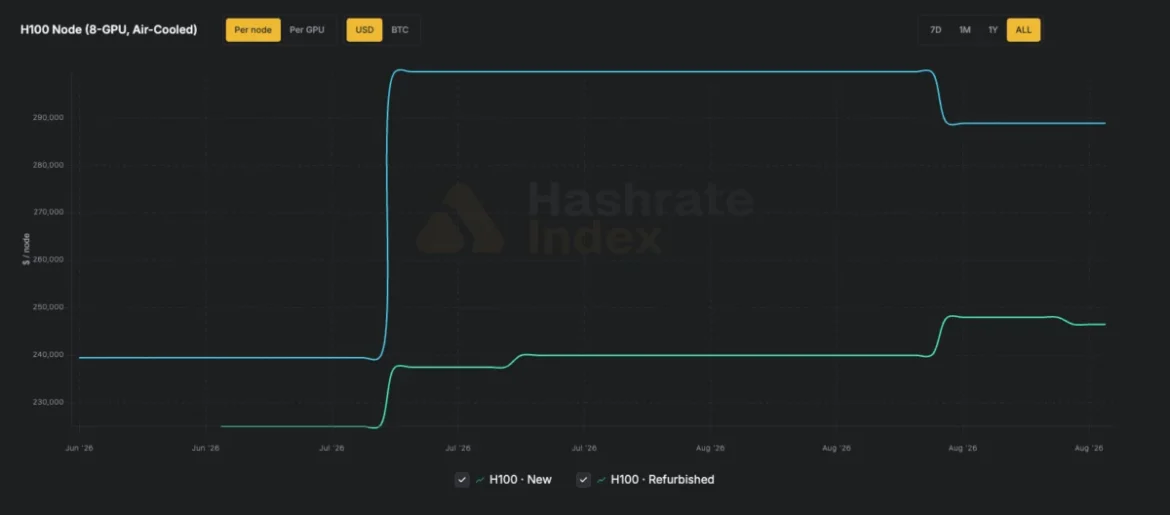
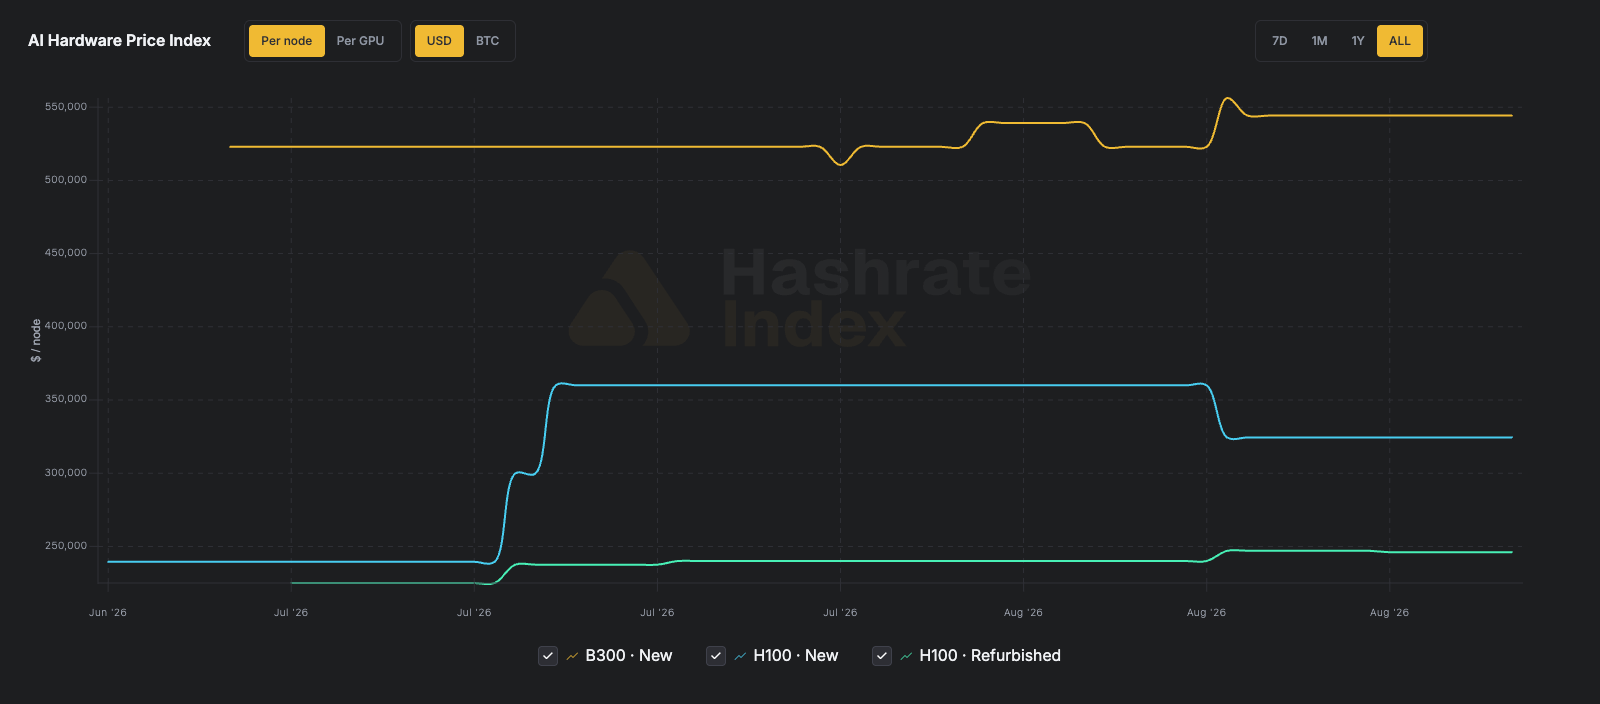
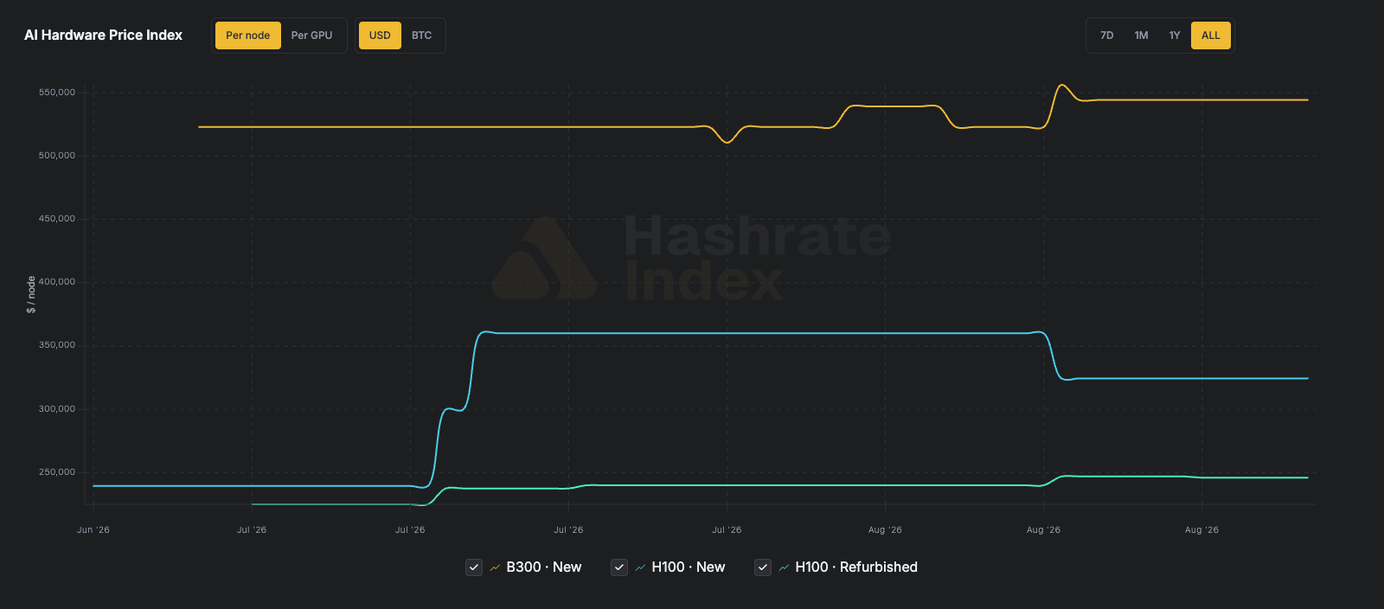
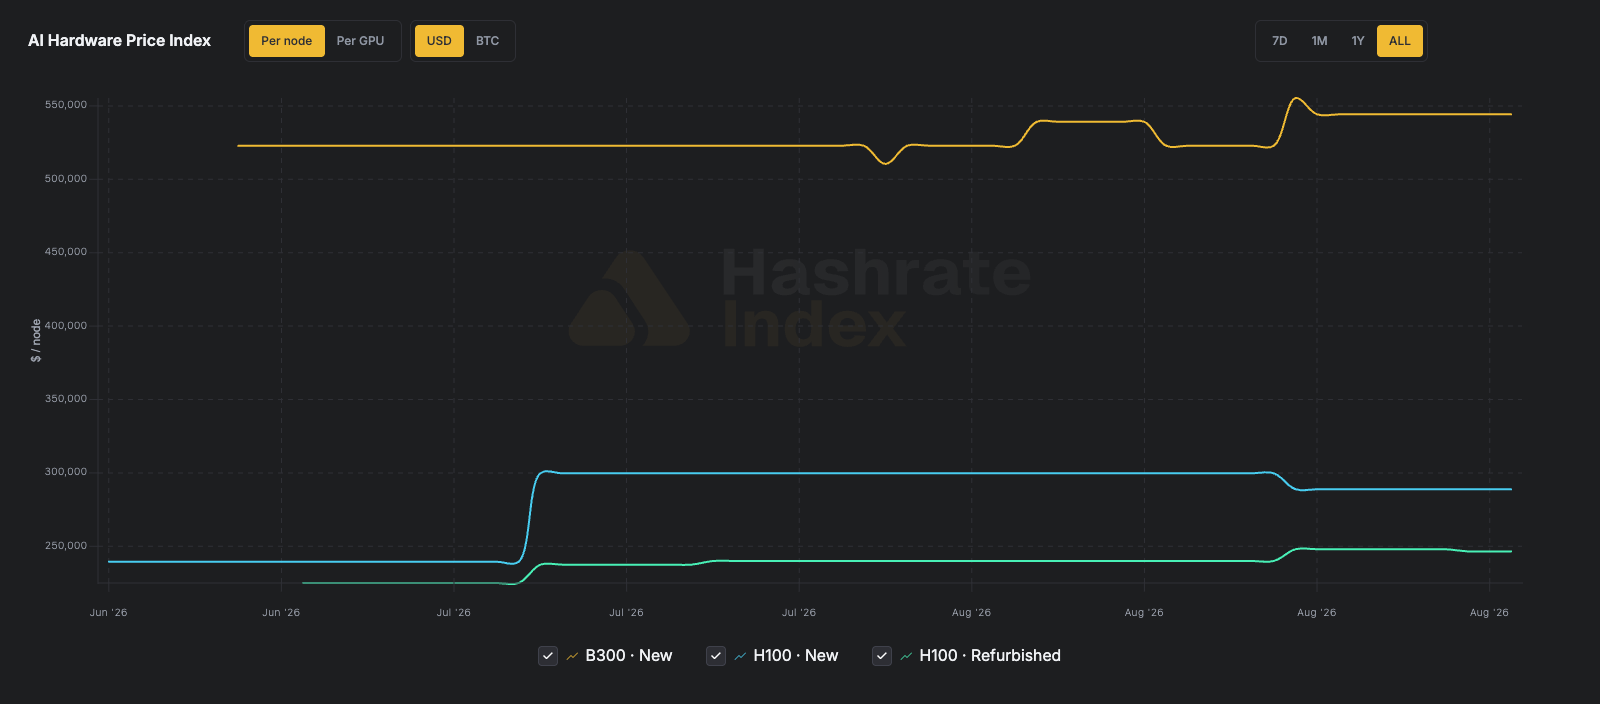
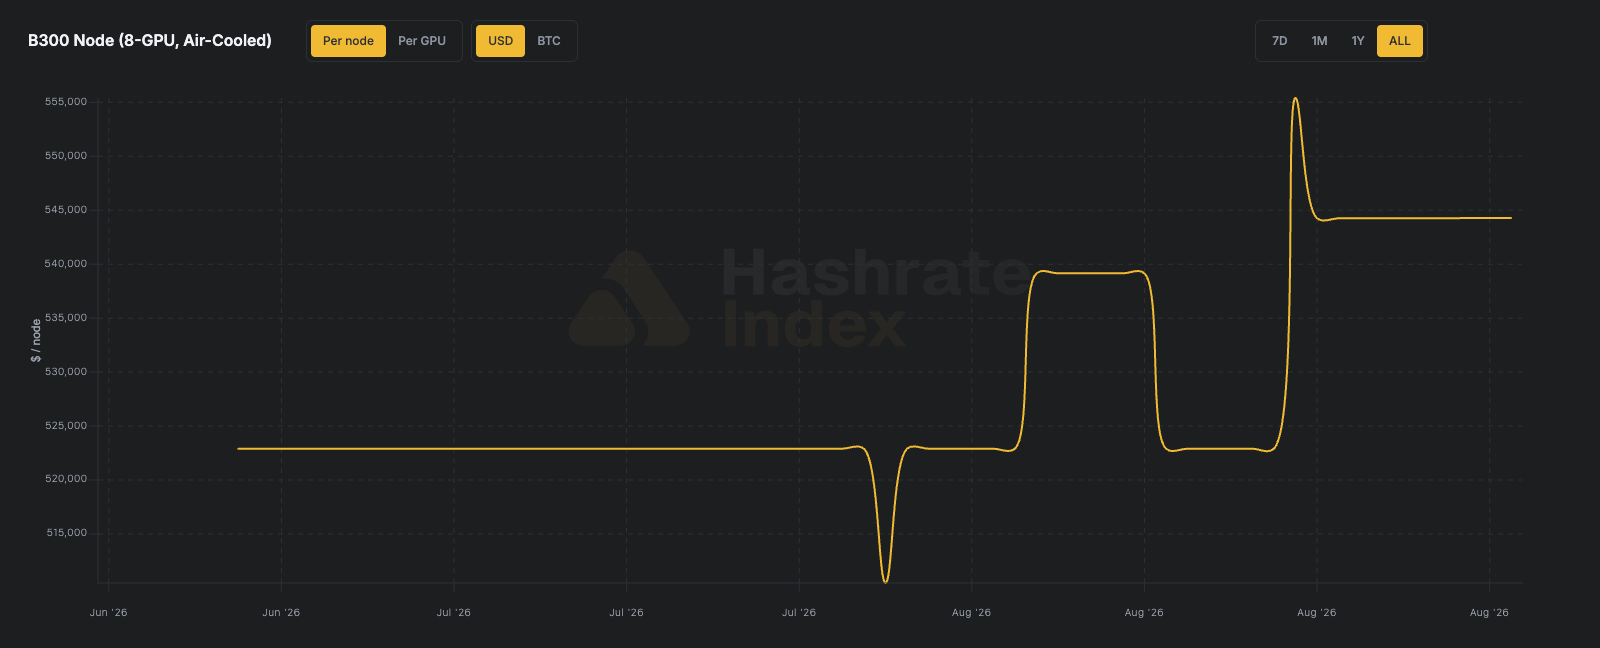
To address these systemic information gaps, Hashrate Index has officially launched the AI Hardware Price Index. By aggregating publicly available asking prices from dozens of vendors, this initiative seeks to provide a baseline for market participants, offering the first consistent, data-driven look at the valuation of core AI infrastructure.

Announcement: Introducing The AI Hardware Price Index

The Chronology of Compute Scarcity

The current landscape of GPU availability is a direct result of the unprecedented surge in generative AI development that began in late 2022. As organizations globally scrambled to secure H100 and subsequent B300-series hardware, the traditional supply chain buckled.

In 2023, the industry saw the emergence of the "compute broker" model, where hardware prices fluctuated daily based on lead times, geographic availability, and secondary market demand. Throughout 2024 and 2025, as Blackwell-architecture chips began to circulate, the market bifurcation between "new" and "refurbished" hardware intensified. During this period, procurement teams were forced to operate in a vacuum, relying on anecdotal evidence and private relationships rather than standardized market metrics. The launch of the AI Hardware Price Index serves as a historical inflection point, marking the transition from an era of anecdotal pricing to one of systematic observation.

Methodology and Data Aggregation

Establishing a reliable index in a non-standardized market requires rigorous selection criteria. The index focuses exclusively on the air-cooled 8-GPU NVIDIA HGX node—a specific, high-demand configuration that acts as a bellwether for the broader industry. By excluding liquid-cooled variants, chassis-only builds, and bare baseboards, the index maintains a "like-for-like" comparison that prevents statistical bias caused by differing cooling infrastructures or peripheral configurations.

Announcement: Introducing The AI Hardware Price Index

Data collection involves monitoring the live, publicly posted asking prices of vendors. Each entry represents a last-observed ask, held in the index until the vendor provides a price update. The resulting data points reflect the median of these active listings. It is essential to note that this index tracks "asking prices"—what sellers are requesting—rather than "transaction prices," which are often subject to non-disclosure agreements and volume-based discounting. This distinction is critical for users to understand: the index provides a ceiling and a reference point for current market sentiment rather than a definitive clearing price for large-scale enterprise contracts.
Analyzing the Current Price Dispersion

The initial data released by the index reveals a striking degree of market inefficiency. Currently, the price spread for an 8-GPU B300 node ranges between $399,999 and $682,000. This represents a 1.71x dispersion, highlighting the extreme variance in how different vendors price their inventory based on inventory turnover, supply chain relationships, and regional tax or logistical considerations.

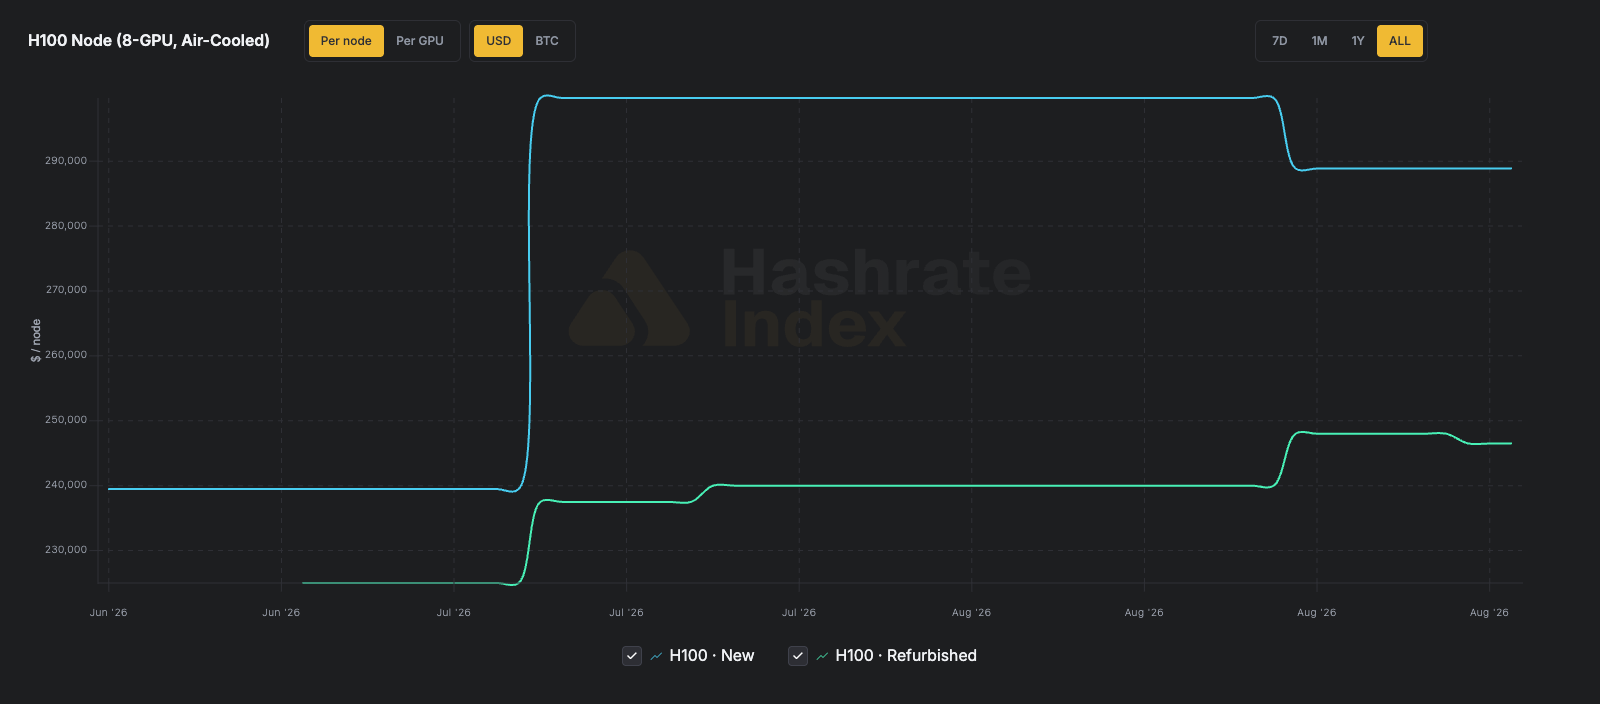
This volatility is mirrored in the Hopper (H100) segment, where the spread for new nodes remains at 1.70x, and refurbished nodes sit at 1.73x. When examining the premium associated with the latest hardware, Blackwell Ultra currently commands approximately 1.68x the price of a new Hopper-based node on a per-GPU basis. While significant, industry analysts note that this premium is narrower than the actual performance differential between the two platforms. This narrowing gap suggests that the market is still absorbing the transition to Blackwell, as H100 units remain readily available and continue to offer a reliable, albeit older, performance baseline.

Announcement: Introducing The AI Hardware Price Index

Furthermore, the relationship between new and refurbished nodes provides a "floor" for the industry. Currently, refurbished H100 nodes are trading at roughly 76% of the asking price for new units. When this is compared to the $179,000 asking price for a bare new HGX H100 8-GPU baseboard—which sits at 73% of the refurbished node price—it becomes clear that the hardware ecosystem is approaching a threshold of "build-versus-buy" efficiency. If the price of a complete, refurbished system continues to drop toward the price of the baseboard, buyers are likely to shift toward component-level procurement to lower their total cost of ownership.

Implications for Data Center Operators and Investors

The lack of price transparency has historically penalized smaller AI startups and independent cloud providers who lacked the scale to negotiate favorable rates directly with OEMs. By democratizing this information, the index empowers these smaller players to perform better due diligence before committing millions of dollars in capital expenditure.

For the investment community, the ability to track the depreciation curve of AI hardware is a transformative development. Just as investors in Bitcoin mining once had to rely on guesstimates to calculate the return on investment for ASIC miners, those funding AI compute infrastructure can now model depreciation and hardware cycles with greater precision. The inclusion of USD/BTC toggles within the index is particularly relevant for entities that operate at the intersection of energy, mining, and AI. As Bitcoin miners increasingly pivot their operations to host AI workloads, the ability to value hardware in terms of both fiat currency and mining revenue allows for a more comprehensive assessment of infrastructure risk.

Announcement: Introducing The AI Hardware Price Index

Broader Impact on the AI Ecosystem

The introduction of this index is not merely a tool for price monitoring; it is a signal of the maturation of the AI hardware market. As the sector evolves from a "gold rush" phase to a more structured utility model, the demand for financial-grade data will only increase.

The industry is currently facing a period of intense scrutiny regarding the ROI of large language model (LLM) training. If compute costs continue to be obscured by inefficient procurement processes, the overall financial health of the AI industry becomes harder to quantify. By shining a light on the cost of the most fundamental unit of AI production—the GPU node—the index provides a mechanism for the market to self-correct.

Future iterations of these datasets are expected to expand beyond SHA-256 (Bitcoin) compute and NVIDIA-based AI hardware. As the market for alternative compute architectures and specialized AI silicon grows, the need for standardized reporting will expand accordingly. The work undertaken by entities like Luxor Technology Corporation represents a necessary step toward the "commoditization of compute," a process that will eventually see high-performance hardware treated with the same financial transparency as other industrial commodities like natural gas or electricity.

Announcement: Introducing The AI Hardware Price Index

Conclusion: Toward a Transparent Future

While the AI Hardware Price Index currently offers a limited view of the total market, it provides a vital anchor for a previously unanchored asset class. As more vendors provide data and more market participants utilize these metrics to guide their procurement strategies, the spread between asking prices is expected to narrow. This convergence will ultimately lead to a more efficient, liquid, and competitive market for the hardware that serves as the backbone of the modern digital economy. For now, the index serves as a reminder that even in the age of advanced artificial intelligence, the most basic principles of supply, demand, and price discovery remain the ultimate arbiters of value. As the industry moves into the next phase of development, this data will likely become a standard tool for every CTO, CFO, and infrastructure architect in the technology sector.

September 18, 2026 0 comment
0 FacebookTwitterPinterestEmail
Crypto Mining & Infrastructure

The Aftermath of the Ethereum Merge: Proof-of-Work Mining Profits Crater as Displaced Miners Overwhelm Alternative Networks

by Nana Muazin September 18, 2026
written by Nana Muazin

The landscape of cryptocurrency mining underwent a historic paradigm shift following the completion of the Ethereum network’s long-anticipated transition to a Proof-of-Stake (PoS) consensus mechanism, widely known as the Merge. By eliminating the need for energy-intensive computational power to validate transactions and secure the blockchain, this architectural upgrade immediately rendered redundant the vast infrastructure of graphics processing units (GPUs) that had historically powered the world’s second-largest cryptocurrency. Consequently, a massive influx of displaced miners redirected their computational power—known as hashrate—toward alternative Proof-of-Work (PoS-free) altcoins. This sudden migration triggered unprecedented difficulty spikes across smaller networks, plunging mining profitability into deeply negative territory and leaving the future of GPU-based mining facing an existential crisis.

The Mechanics of the Migration and the Difficulty Explosion

To understand the severity of the current downturn, one must examine the fundamental economics of Proof-of-Work blockchains. Unlike Bitcoin, which relies primarily on specialized Application-Specific Integrated Circuits (ASICs), the vast majority of secondary PoW cryptocurrencies—such as Ethereum Classic (ETC), Ravencoin (RVN), and Ergo (ERG)—were historically mined using consumer-grade and enterprise graphics cards. Before the Merge, the combined hashrate of these alternative networks was a mere fraction of Ethereum’s immense computational footprint.

When the Ethereum network officially severed ties with its miner base, hundreds of thousands of active GPU rigs were left without a revenue source. While a segment of the mining community chose to liquidate their hardware assets on secondary markets to recoup capital, a significant majority redirected their rigs toward the remaining GPU-mineable chains.

This mass migration collided directly with the automated self-regulating mechanisms inherent to blockchain architectures. Proof-of-Work networks utilize a difficulty adjustment algorithm designed to maintain a relatively constant rate of block production regardless of fluctuations in network participation. As hashrate increases, the network automatically raises the mathematical difficulty required to mine a block. The sudden, exponential surge of former Ethereum miners entering these smaller ecosystems caused a corresponding explosion in mining difficulty. Because the reward pools for these alternative coins remained fixed while the competition to solve blocks multiplied exponentially, individual miners found their daily yields severely diluted.

Death Of GPU Mining? Popular Crypto Profits Go Into Negative As Ethereum Miners Flood Market | Bitcoinist.com

Financial Realities: Examining the Data from WhatToMine

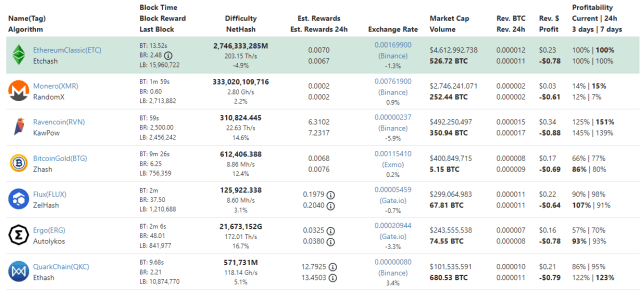
Data compiled from prominent crypto mining profitability calculators, including WhatToMine, illustrates the catastrophic financial reality facing GPU miners in the post-Merge era. An analysis of the market capitalization leaders among remaining Proof-of-Work tokens reveals a complete absence of positive profit margins across the board.

For Ethereum Classic, which emerged immediately following the Merge as the primary destination for displaced GPU miners, hourly returns plummeted into the red. Calculations based on standard operational parameters—assuming an average residential electricity cost of $0.10 per kilowatt-hour (kWh) and utilizing the combined processing power of a standard three-GPU rig equipped with AMD RX 480 cards—yielded a net return of approximately -$0.78 per hour. Even for operators utilizing top-tier, enterprise-grade hardware such as the Nvidia RTX 3090 Ti, efficiency metrics failed to offset rising operational expenditures, with hourly profits stagnating between -$0.50 and -$0.60 depending on local energy tariffs.

When factoring in facility overhead, cooling requirements, and hardware depreciation, the operational cost of running a GPU rig quickly surpasses the fiat value of the block rewards and transaction fees earned. For independent miners operating in regions with moderate to high electricity costs, continuing to power mining equipment has become a liability rather than an income-generating enterprise.

The Chronology of the Transition

The events leading up to this current profitability crisis are the result of years of development, testing, and community deliberation within the Ethereum ecosystem.

Death Of GPU Mining? Popular Crypto Profits Go Into Negative As Ethereum Miners Flood Market | Bitcoinist.com

The conceptual groundwork for the transition away from Proof-of-Work began nearly with the inception of Ethereum itself, driven by concerns regarding the network’s massive carbon footprint and scalability limitations. The timeline accelerated significantly through the deployment of the Beacon Chain in December 2020, which established the parallel Proof-of-Stake infrastructure.

Throughout 2021 and early 2022, developers executed a series of testnet dry runs, culminating in successful merges on the Ropsten, Sepolia, and Goerli test networks. Despite minor delays caused by client software readiness, the core developers finalized the target block height for the mainnet transition in August 2022. On September 15, 2022, the Paris upgrade executed successfully at terminal total difficulty (TTD) 58750000000000000000000, officially concluding Ethereum’s PoW era. Within hours of the transition, the global hashrate supporting Ethereum dropped to zero, setting off the immediate migration wave toward alternative networks and the subsequent difficulty shocks observed across the broader altcoin market.

Industry Reactions and Stakeholder Perspectives

Reactions from across the digital asset industry have underscored a deep ideological and economic divide between proponents of Proof-of-Stake and the traditionalist mining community.

Representatives from major mining pools and hardware manufacturers expressed immediate concern over the lack of market depth among alternative PoW assets. Industry analysts had long warned that no single secondary cryptocurrency possessed the market capitalization or transaction volume necessary to absorb the massive surplus of hashpower previously dedicated to Ethereum. While forks such as Ethereum Classic (ETC) experienced temporary surges in price and network activity immediately preceding and following the Merge, the underlying economic fundamentals could not sustain the sudden influx of computational resources.

Conversely, environmental advocates and institutional stakeholders lauded the Merge as a monumental achievement for the cryptocurrency sector. By reducing global electricity consumption virtually overnight by an estimated 0.2% to 0.4%, the network effectively neutralized the primary criticism lobbied against digital assets by regulators, traditional financial institutions, and ESG (Environmental, Social, and Governance) focused investors. Ethereum developers emphasized that the successful execution of the upgrade paves the way for future scalability enhancements, such as sharding, which would have been significantly more complex to implement under the legacy mining model.

Death Of GPU Mining? Popular Crypto Profits Go Into Negative As Ethereum Miners Flood Market | Bitcoinist.com

Broader Economic Implications and the Future of GPU Mining

The immediate fallout of the Merge extends far beyond individual mining balance sheets, carrying significant implications for hardware manufacturers, global energy markets, and the broader altcoin economy.

For hardware manufacturers such as Nvidia and Advanced Micro Devices (AMD), the sudden cessation of industrial-scale GPU purchases for crypto mining coincides with a broader cooling in consumer electronics demand. The secondary market has experienced a sudden supply glut, with used graphics cards flooding online marketplaces at heavily discounted prices as former miners liquidate inventory to pay off debts or transition to alternative business models. This influx of cheap, heavily used hardware poses short-term pricing challenges for retail GPU sales, though it may ultimately benefit budget-conscious gamers and artificial intelligence researchers seeking cost-effective computational power.

From an energy perspective, the shift has resulted in a localized reduction in industrial power consumption, particularly in regions with historically low electricity tariffs that had previously attracted large-scale mining operations. Miners unable to secure sub-economic power contracts have been forced to shutter operations indefinitely, leading to a permanent contraction of the global crypto-mining footprint.

Looking forward, the long-term viability of graphics card-based mining remains highly uncertain. Industry observers note that for GPU mining to recover its historical profitability, either a substantial contraction in global hashrate must occur—meaning more miners must permanently exit the market—or a new generation of high-valuation, GPU-mineable cryptocurrencies must emerge to absorb the excess capacity. Until such structural market shifts materialize, the era of accessible, profitable home-based and enterprise GPU mining appears to have reached a definitive, sobering conclusion.

September 18, 2026 0 comment
0 FacebookTwitterPinterestEmail
Bitcoin & Core Networks

Bitcoin Market Analysts Predict Steep Bear Market Correction and Target October 2026 for Final Cycle Bottom

by Raul Delapena Setiawan September 17, 2026
written by Raul Delapena Setiawan

The cryptocurrency landscape is bracing for potential turbulence as prominent market analysts forecast a prolonged bearish trajectory for Bitcoin (BTC), suggesting that the leading digital asset could plummet toward the $30,000 threshold by late 2026. Despite recent historical milestones that saw the apex cryptocurrency flirt with all-time highs near $126,000, technical evaluations pointing to established cyclical patterns indicate that the current bear market may have several months left to run.

Projections shared by industry experts point to late 2026—specifically September and October—as the potential window for a definitive cycle bottom. While market participants often look to modern structural shifts, such as the proliferation of spot Exchange-Traded Funds (ETFs) and heightened institutional participation, technical analysts argue that historical cyclical geometry continues to dictate overarching market behavior.

Understanding the 400-Day Bear Market Framework

The cornerstone of the recent bearish projections relies on a recurring macroeconomic and structural phenomenon known within technical analysis circles as the Bitcoin 400-day cycle. Over the past 13 years of recorded trading data, Bitcoin’s macro movements have exhibited a remarkably consistent rhythm. Typically, a protracted bull market spanning approximately 1,064 days is followed by a sharp, corrective bear phase lasting between 364 and 400 days.

According to prominent crypto analyst Bee, who shared detailed insights via social media platform X, Bitcoin is currently approximately 252 days into its active cyclical bear phase. Within the parameters of this historical framework, the digital asset still faces between 112 and 148 days of sustained downward pressure before macro conditions can stabilize sufficiently to foster a genuine, long-term recovery.

The Bitcoin 400-Day Cycle: Historical Performance Shows How Low The Bottom Goes | Bitcoinist.com

By mapping this historical rhythm forward, Bee’s calculations indicate that Bitcoin’s absolute price floor for the current market cycle could materialize in October 2026. The accompanying projection charts suggest that BTC could decline to approximately $30,000 during the first week of the month. Measured against the recent cycle peak of roughly $126,000, a correction to $30,000 would represent a drawdown exceeding 75%, aligning with the historical severity of previous crypto winter troughs.

Technical Indicators and Corroborating Forecasts

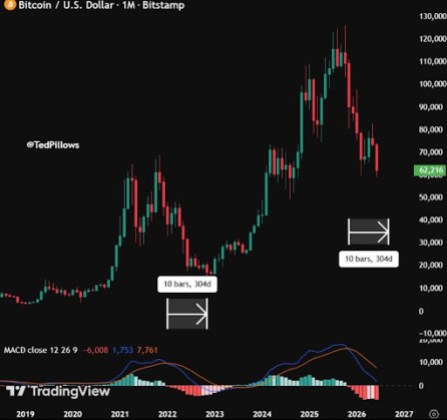
Reinforcing the bearish outlook, fellow crypto analyst Ted Pillows has outlined a complementary timeline derived from momentum indicators. Pillows highlighted the historical behavior of the Moving Average Convergence Divergence (MACD) indicator, specifically pointing to the monthly bearish cross that occurred during the 2022 market contraction.

During that previous cycle, Bitcoin required approximately 10 months following the monthly MACD bearish cross to establish a definitive price bottom. Applying this analog to the current market structure, Pillows anticipates that BTC will reach its cycle floor toward the end of the third quarter (Q3) or the beginning of the fourth quarter (Q4) of 2026.

His technical models project a consolidation and bottoming target zone between $30,000 and $40,000. Furthermore, Pillows has tempered expectations for a swift recovery, noting that a sustained bullish rebound pushing back toward the $100,000 threshold is statistically and technically improbable within the 2026 calendar year.

The Institutional Debate: Are ETFs Changing the Rules?

The Bitcoin 400-Day Cycle: Historical Performance Shows How Low The Bottom Goes | Bitcoinist.com

A central point of contention among market participants is whether historical cycle analyses remain relevant in an era dominated by institutional finance. The introduction and maturation of spot Bitcoin ETFs—led by financial giants such as BlackRock’s iShares Bitcoin Trust (IBIT)—have fundamentally altered market liquidity, daily inflows, and the overall investor base compared to previous retail-heavy cycles.

Skeptics of traditional cycle theories argue that persistent institutional demand creates a structural price floor, shielding Bitcoin from the catastrophic drawdowns characteristic of earlier eras. Proponents of this view suggest that corporate balance sheet allocations, pension fund interest, and regulated wealth management products have rewritten the playbook for digital asset valuation.

However, technical analysts remain steadfast in their adherence to behavioral economics and market psychology. Responding to the institutional paradigm shift, analysts note that every single historical cycle featured its own unique narrative and structural justification for why "this time is different." Whether it was the entry of retail derivatives exchanges in 2017, the emergence of decentralized finance (DeFi) in 2020, or macroeconomic quantitative easing, market structures continually evolve while human sentiment, leverage liquidation cascades, and cyclical exhaustion patterns repeat.

Proponents of the 400-day framework emphasize that these underlying behavioral cycles have persisted across multiple generations of market narratives without a single definitive structural deviation, suggesting that macro liquidity conditions and market maturity timelines ultimately outweigh narrative-driven optimism.

Chronology of the Current Market Cycle

To contextualize the ongoing forecasts, market observers track a distinct sequence of events defining Bitcoin’s recent macroeconomic journey:

The Bitcoin 400-Day Cycle: Historical Performance Shows How Low The Bottom Goes | Bitcoinist.com
  1. The Bull Run Peak: Driven by surging institutional adoption, regulatory milestones, and spot ETF inflows, Bitcoin achieved historic highs approaching $126,000.
  2. The Macro Shift: Following the exhaustion of the bull run, momentum indicators such as the monthly MACD shifted bearish, signaling a transition from expansion to contraction.
  3. The Cyclical Correction: Bitcoin entered a multi-month corrective phase, steadily losing key moving averages and psychological support levels as leveraged positions were systematically cleared from the derivatives market.
  4. Current Status: Bitcoin is currently estimated to be roughly 252 days into its projected 364-to-400-day bear phase, navigating localized volatility while broader macro consolidation continues.
  5. Projected Floor (Late 2026): Technical models converge on September and October 2026 as the timeline for the ultimate cycle bottom, with price targets resting between $30,000 and $40,000.
  6. Anticipated Market Reset: Following the completion of the 400-day correction phase, historical models suggest the foundation could be laid for the subsequent multi-year bullish expansion cycle.

Broader Economic Implications and Market Impact

A correction of the magnitude projected by technical analysts carries significant implications for the broader digital asset ecosystem. Beyond Bitcoin itself, altcoins, decentralized finance protocols, and blockchain venture capital funding typically experience heightened sensitivity and deeper drawdowns during prolonged Bitcoin bear markets.

For institutional investors and long-term holders, a potential descent to the $30,000 region represents both a severe test of conviction and a generational accumulation opportunity. While short-term sentiment is undeniably dampened by forecasts rejecting a swift return to six-figure valuations in 2026, disciplined market participants often utilize these consolidation periods to rebalance portfolios and build positions ahead of future macro cycles.

As the cryptocurrency market navigates the remainder of the current contraction phase, attention will remain focused on macro liquidity indicators, regulatory developments, and institutional flow volumes. Whether historical cyclical models will once again prove accurate or if modern financial infrastructure will soften the blow remains one of the most critical questions facing the digital asset economy.

September 17, 2026 0 comment
0 FacebookTwitterPinterestEmail
Ethereum & Smart Contracts

EF Protocol Cluster Sets Strategic Course for Quantum-Resistant Ethereum by 2029

by Nana Wu September 17, 2026
written by Nana Wu

The Ethereum Foundation (EF) Protocol cluster has officially unveiled a comprehensive multi-year strategic roadmap, marking a decisive shift in its development priorities toward achieving full post-quantum readiness for the Ethereum Layer 1 network by December 2029. This ambitious directive follows months of internal alignment and ecosystem-wide collaboration, crystallizing the technical trajectory for the network as it approaches the upcoming Hegotá upgrade. By setting a hard deadline for quantum resistance, the EF is signaling to the global developer community that Ethereum’s long-term security posture is being prioritized to withstand the potential emergence of cryptographically relevant quantum computers, often referred to as Q-day.

The Path to Quantum Readiness: A 2029 Mandate

The decision to target December 2029 for full post-quantum (PQ) readiness is not merely a technical choice but a strategic imperative. The EF is aligning its internal development milestones with the migration timelines independently established by major technology stakeholders, including Google, Cloudflare, and Microsoft. While the exact arrival of Q-day remains a subject of intense debate among physicists and cryptographers—with many estimates suggesting it may occur well after 2030 or not at all—the EF has opted for a proactive, rather than reactive, security posture.

By treating the 2029 deadline as non-negotiable for at least the next 18 months, the Protocol cluster aims to force necessary architectural changes that might otherwise be deferred. The roadmap assumes a highly aggressive cadence for future hard forks, requiring an average of 7.2 months per major upgrade to move from the upcoming Glamsterdam mainnet deployment to the final post-quantum milestone, currently designated as L*.

The Hegotá Scoping Season and Development Priorities

The scoping process for the Hegotá upgrade, which served as a proving ground for this new collaborative model, involved the analysis of 62 distinct Ethereum Improvement Proposals (EIPs). This process, facilitated by approximately 60 researchers and engineers, was designed to balance immediate network needs with the long-term, non-negotiable requirement of post-quantum security.

Hegotá is not envisioned as the definitive "PQ fork" itself; rather, it is the crucial gateway that will determine whether the subsequent upgrades in the sequence remain on schedule. The consensus-layer centerpiece of Hegotá is EIP-7805, which introduces Fork-choice enforced Inclusion Lists (FOCIL). This mechanism is designed to improve transaction inclusion guarantees, effectively mitigating censorship risks by allowing validators to impose constraints on block builders. Complementing this on the execution layer is EIP-8141, the Frame Transaction model. Together, these upgrades represent a significant leap in network security and censorship resistance, laying the groundwork for the more complex cryptographic migrations to come.

The Five Pillars of Protocol Research

To maintain this accelerated pace, the EF Protocol cluster has organized its research and engineering efforts into five multi-fork arcs. These pillars represent the core technical challenges that must be addressed to ensure Ethereum remains scalable, private, and secure in a post-quantum landscape:

  1. Fast Finality: Aiming to reduce the network’s time-to-finality from the current scale of minutes to mere seconds by decoupling finality from block production.
  2. Post-Quantum Readiness: The overarching mission to harden the execution, consensus, and data layers against quantum threats, utilizing cryptographic agility to allow for future-proof security updates.
  3. Privacy: The integration of protocol-level privacy guarantees that allow for trustless, censorship-resistant transactions, reducing the reliance on third-party intermediaries.
  4. State Management: A long-term initiative to prevent state growth from becoming a bottleneck, involving the migration to a new state trie and decentralized access mechanisms for historical data.
  5. zkEVM: The transition toward mandatory execution proofs, which will eventually allow validators to verify succinct proofs instead of re-executing every block, drastically reducing the computational burden on the network.

Chronology and Delivery Pipeline

The development pipeline has been formalized to ensure that every proposal adds tangible evidence and reduces technical uncertainty before being integrated into a hard fork. The progression follows a strictly defined lifecycle: Research, EIP, Prototype, Devnet, Public Fork Implementation (PFI), Client-specific Implementation (CFI), and finally, Mainnet deployment.

The following table summarizes the shift in priority levels for the Protocol cluster following the conclusion of the Glamsterdam development phase:

Priority As of Q2 2026 Post-Glamsterdam
P0 Keep mainnet safe Keep mainnet safe
P1 Ship Glamsterdam and Hegotá Path to Minimum Viable Post-Quantum (MV-PQ)
P2 Capacity for I* fork Capacity for K and L (PQ acceleration)
P3 Research for 5 arcs Research for 4 arcs + Formal Verification

Implications for the Ecosystem

The commitment to a 7.2-month fork cadence presents a substantial challenge for the wider Ethereum ecosystem. Historically, such a rapid sequence of upgrades has been rare, and success will depend on unprecedented levels of collaboration between the EF, independent client teams, academic researchers, and the broader developer community.

The move toward "Minimum Viable Post-Quantum" (MV-PQ) at the J* milestone serves as a contingency measure. MV-PQ is intended to keep the network functional through the arrival of quantum threats with reduced, yet sufficient, security guarantees while the full suite of post-quantum attestations and finality gadgets are finalized. This staged approach allows the network to maintain its security guarantees without being locked into a single, potentially fragile, design path.

Stakeholder Perspectives and Future Outlook

The EF’s recent communications emphasize that this is an ecosystem-wide effort. The requirement for more personnel—spanning cryptographers, security auditors, and client engineers—suggests that the EF will likely increase its support for grant recipients and external contributors who can assist in the intensive testing and verification phases.

The reliance on formal verification as a cross-cutting tool is perhaps the most significant departure from past practices. By treating formal verification as a core dependency for all five research arcs, the EF is attempting to front-load the security review process, aiming to catch vulnerabilities in the design phase rather than during the testing of mainnet-ready code.

As the community looks toward the upcoming AMA on September 16, the focus will undoubtedly be on the feasibility of these aggressive timelines. Critics of the roadmap may point to the history of protocol delays, while proponents argue that the shift to a structured, priority-driven model provides the necessary framework to overcome the inertia that has previously hindered major L1 upgrades.

Ultimately, the EF’s strategy reflects a broader evolution in the management of public blockchain infrastructure. By explicitly defining what the Protocol cluster will—and will not—do, the Foundation is attempting to provide a clear, predictable signal to the market and the developer ecosystem. Whether this 2029 deadline acts as a galvanizing force or an impossible target, it is clear that the future of Ethereum is being designed with the assumption that the fundamental security assumptions of today will not hold forever. The coming years will serve as a critical test of whether a decentralized, global network can maintain its agility and innovation while simultaneously executing a massive, multi-year security overhaul.

September 17, 2026 0 comment
0 FacebookTwitterPinterestEmail
Bitcoin & Core Networks

XRP Defends $1.30 Threshold as Traders Navigate Federal Reserve Rate Hike and Unwinding Short Positions

by Pevita Pearce September 17, 2026
written by Pevita Pearce

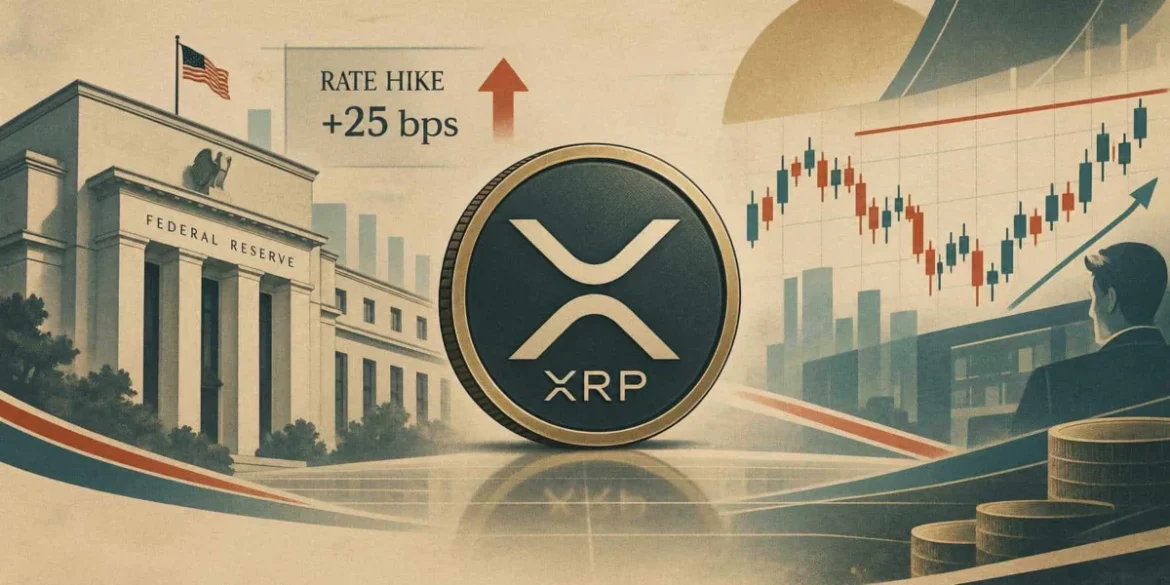
XRP is hovering near the $1.30 mark following a volatile week of trading that has forced market participants to closely evaluate a confluence of macroeconomic headwinds, technical resistance levels, and shifting derivatives positioning. The digital asset’s recent stabilization comes directly on the heels of the Federal Open Market Committee (FOMC) meeting, where central bankers elected to increase the benchmark interest rate by 25 basis points. This move shifted the federal funds target range to 3.75%–4.00% and marked the first monetary tightening initiative by the U.S. central bank since 2023, instantly injecting renewed uncertainty into cryptocurrency markets and other risk-sensitive asset classes.

The intersection of restrictive macroeconomic policy, a resilient U.S. dollar, and localized derivatives liquidations has created a complex landscape for digital asset investors. While XRP has managed to claw its way back to familiar territory around $1.30, analysts are emphasizing the distinction between a natural technical relief rally and a structural trend reversal. As the broader market digests higher Treasury yields and cooling equity valuations, market participants are weighing whether current price action represents a sustainable floor or merely a temporary pause before the next leg of volatility.

Macroeconomic Catalysts and the FOMC Rate Decision

XRP Price Prediction: FOMC Rate Hike Sparks Short Covering as XRP Reclaims $1.30 Support

The primary catalyst driving volatility across traditional and digital financial markets was the September 16 FOMC meeting. In a unanimous decision, Federal Reserve policymakers pushed the federal funds target range to 3.75%–4.00%, pointing to economic activity that continues to expand at a solid pace alongside inflation readings that remain stubbornly elevated. The central bank explicitly stated that the rate adjustment was engineered to foster a timelier return to its long-term 2% inflation objective.

Federal Reserve leadership reinforced these hawkish undertones during subsequent press briefings. Officials described inflation as remaining too high for too long, underscoring an institutional commitment to maintaining price stability even at the expense of speculative risk assets. Furthermore, updated economic projections released by the central bank indicate that policymakers anticipate a median federal funds rate of 4.1% by the close of 2026, up significantly from the 3.6% projection issued in June. This upward revision signals that the era of aggressive monetary easing remains distant, keeping borrowing costs elevated for an extended duration.
Financial markets responded swiftly to the policy shift. Traditional equity benchmarks experienced immediate downward pressure, with the S&P 500 declining by 1% and the Nasdaq Composite slipping 0.7% following the announcement. Concurrently, U.S. Treasury yields climbed higher as bond investors priced in a more restrictive monetary trajectory. For cryptocurrency markets, which rely heavily on accessible systemic liquidity and speculative risk appetite, these tighter financial conditions have acted as a persistent headwind, capping aggressive upside momentum across major altcoins, including XRP.

Derivatives Positioning and the Mechanics of Short Covering

XRP Price Prediction: FOMC Rate Hike Sparks Short Covering as XRP Reclaims $1.30 Support

Beneath the macro-level pressures, structural shifts within the derivatives market have played a decisive role in shaping XRP’s immediate price action. Ahead of the September 16 FOMC announcement, market participants built substantial bearish exposure, anticipating that a hawkish monetary policy decision would trigger a sharp liquidation cascade across risk assets.

However, as XRP held its ground near local support rather than breaking down into a deeper capitulation, these bearish bets became vulnerable. Crypto market analysts monitoring perpetual futures data noted a significant wave of short covering as traders began repurchasing the underlying asset to exit their short positions. Short covering frequently accelerates upward price movements over compressed timeframes, as the mandatory buying required to close out bearish contracts injects artificial and sudden demand into the order book.

While this influx of short-term buying successfully propelled XRP back toward the $1.30 psychological threshold, market analysts caution that unwinding bearish positions is fundamentally different from the establishment of fresh, long-term bullish capital. A reduction in short exposure can provide immediate relief and facilitate a technical rebound, but it does not inherently guarantee that the broader macro-driven downtrend has concluded. Consequently, traders are looking toward volume profiles and technical indicators to gauge whether real organic demand is entering the market at these levels.

Technical Landscape: Navigating Key Resistance and Support Zones

XRP Price Prediction: FOMC Rate Hike Sparks Short Covering as XRP Reclaims $1.30 Support

From a technical perspective, XRP is currently locked in a battle to establish dominance over several critical price thresholds. Market data indicates that the asset is striving to consolidate above a Point of Control (POC) situated near $1.2862. The POC represents the exact price level where the highest volume of trading occurred within the recent measurable range, making it a critical barometer for market equilibrium.

Immediate overhead resistance presents a formidable barrier for the token. A tight resistance cluster has formed between $1.32 and $1.35, reinforced by multiple short-term exponential moving averages. Specifically, the 10-period exponential moving average (EMA) sits near $1.345, the 20-period EMA rests around $1.347, and the 30-period EMA hovers near $1.325. Furthermore, classic and Fibonacci pivot calculations place the central pivot level at approximately $1.354. A decisive and sustained daily close above this $1.32–$1.35 resistance band would be required to fundamentally alter the short-term technical structure and open the door toward higher Camarilla resistance targets at $1.445, $1.510, and $1.575.

Conversely, failure to maintain ground above current levels leaves XRP exposed to downside risks. Camarilla pivot calculations identify immediate support tiers at $1.314, $1.249, and $1.184. If broader macroeconomic pressures intensify or if short-term buying momentum evaporates, the token could revisit these lower boundaries.

Broader momentum indicators present a mixed picture. While the 14-period Relative Strength Index (RSI) has begun to tick upward from its recent lows—signalling a minor amelioration in buying momentum—it remains subdued below the neutral midpoint at approximately 43.82. Simultaneously, the Moving Average Convergence Divergence (MACD) indicator continues to generate a bearish signal, reflecting the underlying tension between short-term relief bounces and prevailing medium-term moving average resistance. Aggregate technical snapshots from major charting platforms reflect this cautious sentiment, with a majority of moving averages retaining a neutral-to-bearish bias while oscillators remain predominantly neutral.

XRP Price Prediction: FOMC Rate Hike Sparks Short Covering as XRP Reclaims $1.30 Support

Higher-Timeframe Perspective and Historical Context

When viewed through a higher-timeframe lens, the significance of psychological and structural support zones becomes even more pronounced. Multi-month chart analyses point to the $1.00 psychological threshold as a cornerstone for long-term XRP market structure. This level benefits from significant technical confluence, encompassing multi-month historical support, swept lows, previously broken highs, and historical engulfing candle closes.

The asset’s resilience is further contextualized by its price trajectory earlier in the year. During the summer months, XRP experienced severe downward pressure, culminating in a sharp drop to approximately $0.98 on August 18—its lowest valuation since November 2024. However, the subsequent defense and recovery from sub-dollar levels demonstrated robust buyer appetite at historical value areas, preventing a more catastrophic structural breakdown.

Analysts emphasizing higher-timeframe structures argue that transient volatility and short-term rejections must be weighed against multi-month candle closes, which often provide a more accurate reflection of macro accumulation trends. Nevertheless, the frequent re-testing of these multi-month boundaries highlights the sensitivity of the asset to broader liquidity cycles.

XRP Price Prediction: FOMC Rate Hike Sparks Short Covering as XRP Reclaims $1.30 Support

Implications for Market Participants

As the cryptocurrency market moves through the latter half of September 2026, XRP finds itself at a pivotal crossroads. At the time of writing, the asset trades near $1.30, supported by a market capitalization of approximately $81.9 billion and a 24-hour trading volume hovering around $2.6 billion.

The interplay between restrictive Federal Reserve monetary policy and localized derivatives positioning leaves the immediate market outlook finely balanced. While the recent unwinding of short positions has provided a welcome buffer and propelled XRP back above its volume-weighted point of control, the broader macroeconomic backdrop—characterized by sticky inflation, elevated borrowing costs, and cautious institutional risk appetite—demands a high degree of caution.

For traders and investors alike, the coming sessions will hinge on price confirmation. To establish a durable bullish continuation, XRP must successfully digest the overhead resistance cluster between $1.32 and $1.35 and transition short-term relief into genuine long-term capital accumulation. Until such confirmation materializes, the digital asset remains anchored to critical technical boundaries, vulnerable to both macroeconomic shocks and the shifting tides of derivatives market sentiment.

September 17, 2026 0 comment
0 FacebookTwitterPinterestEmail
Ethereum & Smart Contracts

Ethereum Under Pressure: Whale Accumulation Points to Market Consolidation Amid Sub-$1,700 Struggles

by Suro Senen September 17, 2026
written by Suro Senen

Ethereum continues to navigate a challenging macroeconomic and technical landscape, languishing below the $1,700 threshold as market apathy and pervasive uncertainty keep participants on the sidelines. While the broader cryptocurrency market searches for a definitive bottom following a steep multi-month correction, on-chain metrics reveal a fascinating divergence in network behavior. Analysts point out that while everyday retail activity has sharply contracted, larger institutional entities and high-net-worth investors—commonly referred to as whales—are quietly consolidating their positions. This dynamic paints a picture of a tightening market float, even as price charts reflect persistent bearish momentum.

Main Facts and Current Market Structure

The second-largest cryptocurrency by market capitalization has been trading under heavy bearish control on daily timeframes, hovering near the $1,630 mark. This follows a brutal breakdown from a multi-month consolidation range that had previously defined price action earlier in the year. The loss of the crucial $1,800-to-$1,900 support zone served as a major catalyst for accelerated selling pressure, ultimately dragging Ether down to fresh annual lows near the $1,500 region.

From a structural standpoint, Ethereum’s series of lower highs and lower lows remains intact. The recovery efforts witnessed earlier in the year peaked near $2,400 before sellers aggressively regained command of the order books. Furthermore, the asset’s price is currently situated well below its major moving averages, including the 50-day, 100-day, and 200-day simple moving averages across multiple timeframes.

Ethereum Whales Stay Active As Retail Participation Collapses – History Offers A Clue | Bitcoinist.com

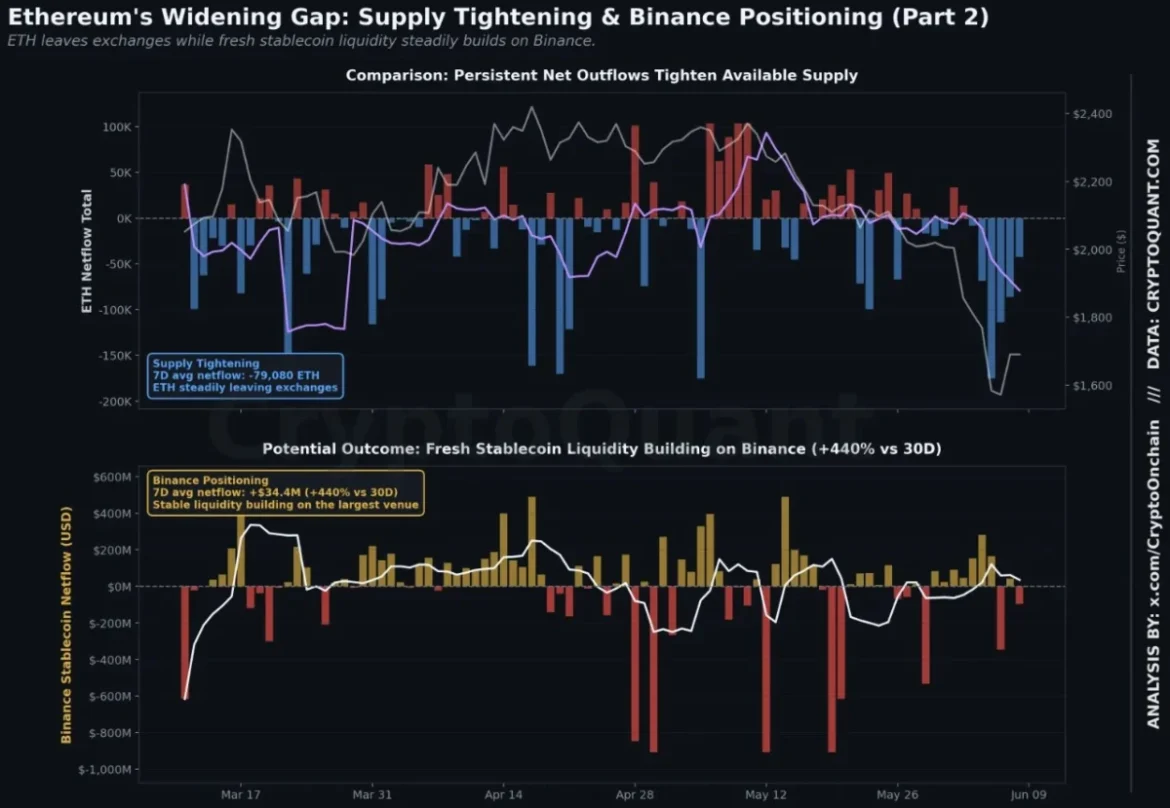
Despite this grim technical outlook, specialized network intelligence data compiled by platforms like CryptoQuant tells a nuanced story. On-chain metrics highlight a stark behavioral split between retail users and large-scale holders, suggesting that the current price weakness may not be indicative of fundamental network decay, but rather a classic period of accumulation by sophisticated capital.

Chronology of the 2026 Downtrend

To understand Ethereum’s current predicament, it is essential to trace the chronology of market events that shaped the asset’s trajectory throughout the year:

  • Early First Quarter: Ethereum established a prolonged consolidation range between $1,800 and $2,400, acting as a period of equilibrium where buyers and sellers repeatedly tested institutional demand zones.
  • April to May Recovery Window: A brief bullish wave pushed prices toward local highs near $2,400. However, this rally failed to establish a higher high, creating a localized technical ceiling that ultimately favored the bears.
  • Late May Breakdown: The crucial $1,800-to-$1,900 support floor, which had successfully absorbed downward pressure for months, decisively gave way under mounting macroeconomic headwinds and waning speculative interest.
  • June Sell-Off and Volume Spikes: The loss of support triggered a cascading wave of liquidations, generating some of the highest trading volume spikes seen in months. Prices plunged toward a local floor near $1,500, where buyers finally stepped in to mount a temporary defense.
  • Present Day: ETH stabilizes below $1,700, with market participants closely monitoring the $1,500-to-$1,550 zone as the primary battleground for a potential macro base-building phase.

On-Chain Data and the Whale-Retail Divergence

A deeper dive into on-chain analytics reveals why seasoned market observers are paying close attention to current blockchain telemetry. According to data highlighted by analyst CryptoOnchain, daily transactions originating from regular retail wallets have plummeted by approximately 43% over the past week. Taken in isolation, such a steep decline in transaction counts would typically signal a network losing active users and fading into irrelevance.

However, this metric directly opposes another critical on-chain indicator: the average value transferred per transaction. Over the same timeframe, the average transfer size has surged by more than 184%, with the median transfer size exhibiting an even more dramatic upward trajectory.

Ethereum Whales Stay Active As Retail Participation Collapses – History Offers A Clue | Bitcoinist.com

This statistical divergence—fewer overall transactions, but significantly larger capital movements—is a well-documented phenomenon during historical periods of market stress. Retail participants, driven by uncertainty and apathy, tend to step aside and halt routine interactions with the blockchain. Conversely, high-net-worth investors and institutional players seize the opportunity to execute deliberate, high-value accumulation strategies. Rather than indicating a dying network, the data reflects a consolidation of capital into fewer, stronger hands.

Exchange Flows and Liquidity Dynamics

Supporting the on-chain accumulation thesis is a closer examination of exchange netflows and stablecoin reserves. Ethereum netflows remain deeply negative, sitting at approximately -79,080 ETH. This indicates a consistent, ongoing withdrawal of spot tokens away from centralized trading platforms and into cold storage or decentralized finance (DeFi) protocols, effectively removing immediate selling pressure from the active order books.

Concurrently, fresh capital has begun arriving on major derivatives and spot exchanges, particularly through stablecoin channels. Stablecoin netflows into Binance have spiked to a strongly positive +$34.4 million, representing a staggering 440% increase compared to the 30-day average. This influx of sidelined liquidity arrives precisely as spot ETH is being drained from exchange reserves.

Derivatives data corroborates this institutional positioning. Open interest on Binance has expanded by roughly 9% over the quarter, signaling that larger market participants are quietly building leveraged exposure alongside their spot accumulation. This dual movement—tightening spot supply combined with parked buying power—creates a classic structural setup where the available market float shrinks while potential purchasing power accumulates on the sidelines.

Ethereum Whales Stay Active As Retail Participation Collapses – History Offers A Clue | Bitcoinist.com

Technical Analysis and Key Price Levels

From a technical perspective, Ethereum’s immediate path forward depends heavily on how price action behaves around key historical levels. The breakdown below $1,800 has turned former support into formidable resistance. Unless buyers can orchestrate a sustained volume-backed move to reclaim the $1,800-to-$1,900 band, technical analysts warn that any short-term rallies will likely be categorized as corrective bounces within a broader, multi-month downtrend.

The immediate line in the sand is the $1,500-to-$1,550 region. Having survived the initial shock of the June sell-off, this zone represents the most critical demand cluster of the year. A successful defense of this area could provide the foundation necessary to build a durable base, following a brutal 35% retracement from May highs. Conversely, a failure to hold this psychological and technical floor could invite an extended retest of lower historical liquidity pockets.

Broader Impact and Market Implications

The broader implications of this current market structure extend far beyond short-term price fluctuations. Historically, prolonged periods of retail apathy coupled with aggressive whale accumulation have served as the precursor to significant medium-to-long-term trend reversals. While structural setups do not guarantee an immediate bullish breakout—as they require macroeconomic or fundamental catalysts to activate—they heavily influence market asymmetry.

By removing liquid supply from exchanges while simultaneously building dry powder via stablecoin reserves, large institutional players are positioning themselves to capture disproportionate upside when market sentiment eventually shifts. For the broader digital asset ecosystem, Ethereum’s current phase underscores the ongoing maturation of its investor base, where macro uncertainty shakes out short-term retail speculation while cementing the asset’s footprint among deep-pocketed long-term allocators. As the market searches for a definitive macro bottom, all eyes remain locked on whether the developing supply squeeze will find the catalyst it needs to trigger a broader recovery.

September 17, 2026 0 comment
0 FacebookTwitterPinterestEmail
DeFi (Decentralized Finance)

Synthetix Unveils Snaxpot: A $500,000 Weekly Rewards Program to Supercharge Ethereum Mainnet Perpetual Trading

by Lina Hope September 17, 2026
written by Lina Hope

Following nine months of intensive development focused on architecting a high-performance, feature-rich perpetual futures trading venue on the Ethereum Mainnet, the Synthetix core contributor team has announced the launch of a major new ecosystem incentive program titled Snaxpot. Designed to elevate user engagement and provide tangible rewards to active traders, Snaxpot introduces a gamified weekly rewards model anchored by a staggering grand prize pool of $500,000, distributed as $150,000 in USDT and one million SNX tokens.

The initiative arrives at a pivotal juncture for decentralized finance (DeFi), as protocols increasingly vie for liquidity and user retention on Layer 1 infrastructure. By combining advanced trading interfaces, expanding liquidity pools, and sustainable long-term incentive structures, Synthetix aims to cement its status as a premier perpetual trading destination not only within the Ethereum ecosystem but across the broader decentralized exchange (DEX) landscape.

Background and Strategic Intent

Snaxpot: Trade for Your Chance to Win $500K

Over the past several years, the decentralized derivatives market has experienced exponential growth, transitioning from experimental order books to sophisticated, high-throughput margin trading environments. Synthetix has long stood as a foundational liquidity layer within this sector, pioneering synthetic assets and decentralized liquidity provisioning. However, as competition intensifies among perpetual exchange protocols, platforms are increasingly challenged to implement user acquisition and retention frameworks that move beyond basic token emissions, which have historically proven susceptible to mercenary capital flight.

The introduction of Snaxpot represents a strategic shift toward sustainable, activity-based rewards. According to core team statements, the program is engineered to align long-term platform loyalty with immediate trading incentives. By tying eligibility directly to platform utilization—specifically trading activity on Synthetix Perps—the protocol seeks to establish a sticky user base. Furthermore, the integration of upcoming SNX staking multipliers creates a synergistic economic loop, encouraging participants to hold and stake the native ecosystem token while actively trading.

Mechanics of the Snaxpot Program

Snaxpot operates as a weekly recurring rewards program structured around a verifiable lottery-style drawing mechanism. Participants earn tickets based on their trading volume and interaction with the Synthetix Perps venue throughout each weekly cycle.

Snaxpot: Trade for Your Chance to Win $500K

The structural mechanics of the draw rely on a combination of regular numbers and an additional specialty token designation known as the "Snax Ball." The ultimate grand prize—awarded to a ticket matching five regular balls plus the Snax Ball—triggers the headline $500,000 payout, comprising $150,000 in USDT stablecoins and one million SNX governance tokens. Tiered subsidiary prizes are also distributed for partial matches, ensuring a broad distribution of rewards across the active trading cohort rather than concentrating payouts entirely on a single weekly winner.

Weekly operating cycles are standardized on a strict Monday-to-Sunday Coordinated Universal Time (UTC) schedule. Ticket accumulation takes place continuously throughout the trading week, culminating in a systematic snapshot and subsequent drawing phase. This predictable cadence is designed to maintain high engagement levels and provide traders with clear milestones for participation.

Verifiability and Cryptographic Fairness

In the wake of numerous historical exploits and trust issues surrounding centralized random number generators in blockchain gaming and lotteries, Synthetix has prioritized absolute transparency for the Snaxpot draws. The protocol utilizes Chainlink VRF (Verifiable Random Function) v2 deployed directly on the Ethereum Mainnet.

Snaxpot: Trade for Your Chance to Win $500K

Chainlink VRF is an industry-standard cryptographic mechanism designed to ensure that random numbers generated on-chain cannot be tampered with, predicted, or manipulated by miners, node operators, or even the protocol developers themselves. Within the Snaxpot architecture, independent VRF calls are utilized for both the ticket-number assignment phase and the subsequent winning-number draw. Because these cryptographic proofs are generated entirely on-chain, any participant or third-party auditor can independently verify the absolute fairness and integrity of every weekly outcome. This cryptographic assurance is expected to bolster institutional and high-net-worth trader confidence, as verifiable fairness remains a critical prerequisite for large-scale decentralized trading venues.

Amplifying Engagement Through SNX Staking Multipliers

A core tenet of the Synthetix economic design has always been the utility and value capture of the SNX token. To further reinforce this tokenomic loop, the protocol has announced an upcoming tiered multiplier system designed to reward long-term SNX holders and stakers.

Under this upcoming framework, traders who stake qualifying amounts of SNX within their accounts will receive an accelerated ticket multiplier on their trading activity. This means that a dedicated ecosystem participant engaging in the same volume of perpetual trades as an unbonded user will accrue significantly more Snaxpot tickets, scaling upward according to the size of their staked position. Analysts note that this mechanism serves a dual purpose: it drives demand for SNX token lockups—thereby reducing circulating supply—while simultaneously supercharging the engagement of the platform’s most committed community members.

Snaxpot: Trade for Your Chance to Win $500K

Broader Industry Implications and the 2026 Roadmap

The launch of Snaxpot does not stand as an isolated marketing campaign; rather, it represents the opening salvo in a broader strategic push outlined in the official Synthetix 2026 Roadmap. As Ethereum Mainnet continues to scale through layer-2 integrations and rollup ecosystems, established liquidity hubs are fiercely competing to capture mindshare and sustainable volume.

Market observers suggest that incentive programs structured around high-value grand prizes combined with stablecoin liquidity are becoming the gold standard for protocol growth. By offering a blend of liquid stablecoins (USDT) and native protocol equity (SNX), Synthetix provides an asymmetric upside that appeals to both risk-averse traders seeking yield preservation and bullish speculators invested in the protocol’s long-term trajectory.

The success of Snaxpot will likely serve as a barometer for how decentralized derivatives platforms can successfully gamify user acquisition without sacrificing balance sheet health or falling prey to unsustainable inflationary spirals. With its robust cryptographic foundations via Chainlink VRF, deep liquidity reserves accumulated over nine months of intensive engineering, and a clear roadmap for the remainder of the year, Synthetix is positioning itself to capture a dominant market share in the decentralized perpetual futures sector. As the inaugural weekly draws approach, market participants and rival protocols alike will be closely monitoring whether Snaxpot delivers on its promise to redefine user engagement on Ethereum Mainnet.

September 17, 2026 0 comment
0 FacebookTwitterPinterestEmail
Newer Posts
Older Posts

Recent Posts

  • Orderly Network Surpasses $100 Billion In Cumulative Trading Volume
  • Ethereum Network Upgrade Glamsterdam Prepares for Sepolia Activation to Advance Layer 1 Scalability
  • Lido DAO Executes Vote 206: A Deep Dive Into Ethereum Staking Infrastructure Maintenance And Operational Refinements
  • Synthetix Launches Native Multicollateral Margin on Ethereum Mainnet, Enabling Traders to Use Ether as Collateral Without Selling Their Holdings
  • Maxon Integrates Third-Party AI Chatbots Like ChatGPT and Claude into Cinema 4D via Model Context Protocol

Recent Comments

No comments to show.
  • Facebook
  • Twitter

@2021 - All Right Reserved. Designed and Developed by PenciDesign


Back To Top
Crypto Gohan
  • Home

We are using cookies to give you the best experience on our website.

You can find out more about which cookies we are using or switch them off in .

Crypto Gohan
Powered by  GDPR Cookie Compliance
Privacy Overview

This website uses cookies so that we can provide you with the best user experience possible. Cookie information is stored in your browser and performs functions such as recognising you when you return to our website and helping our team to understand which sections of the website you find most interesting and useful.

Strictly Necessary Cookies

Strictly Necessary Cookie should be enabled at all times so that we can save your preferences for cookie settings.