• Home
Crypto Gohan
keep your memories alive
Global Cryptocurrency News

Bitcoin Smashes Through $85,000 Milestone to Reach Highest Price Level in Eight Months

by Basiran September 21, 2026
written by Basiran

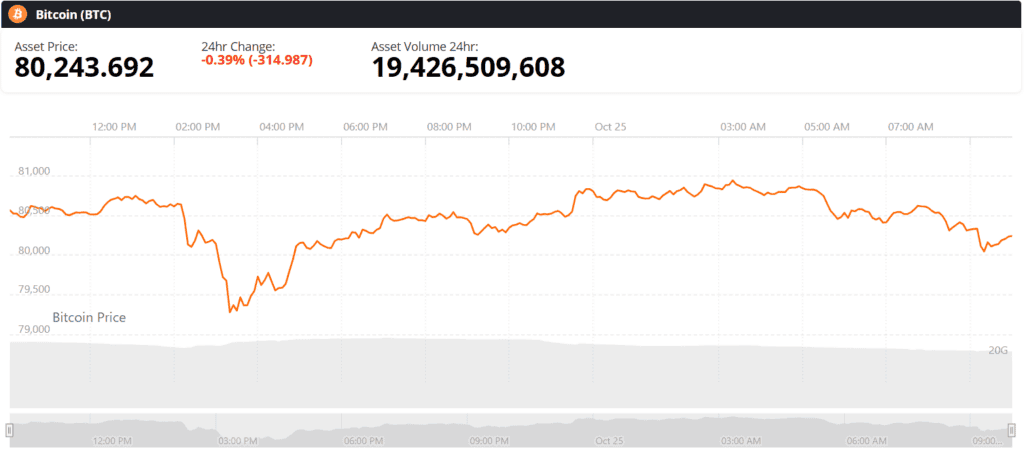
Bitcoin surged past the critical $85,000 threshold on September 21, breaching a psychological and technical barrier that the flagship cryptocurrency had failed to visit since January of this year. The sharp upward movement drove the asset to an intra-session high of $85,174.35, according to validated spot-market exchange data. This significant milestone breaks a prolonged consolidation and downward pressure phase that characterized much of the preceding eight months, during which market participants watched repeated relief rallies stall out well below the winter highs.

While the sudden price action has invigorated traders and long-term holders alike, financial analysts emphasize that reclaiming a round number is only the first step in establishing a sustainable trend. The immediate focus for institutional desks, retail platforms, and derivatives traders alike has shifted from the initial breakout to whether the market can successfully defend this newly conquered territory over upcoming daily and weekly candle closes.

Anatomy of the Breakout and Eight-Month Context

The journey to the mid-$85,000 region has been marked by persistent macroeconomic headwinds, regulatory uncertainty, and shifting liquidity dynamics across global financial markets. Throughout the first, second, and third quarters of the year, Bitcoin struggled to regain the momentum that defined its early winter surge. Resistance levels were firmly established near the high $70,000s and low $80,000s, turning those zones into formidable ceilings that repeatedly repelled bullish advances.

During these months of range-bound trading, market sentiment frequently fluctuated between cautious optimism and capitulation fears. Volumes contracted during the summer months, a historically sluggish period for digital assets, creating an environment ripe for sudden volatility spikes. As liquidity slowly returned to traditional and digital asset markets heading into September, the underlying order book dynamics began to shift. Large-scale buyers, often referred to in the industry as whales, alongside institutional accumulation via spot exchange-traded funds (ETFs), began absorbing available sell-side liquidity.

The tipping point arrived on September 21, when a sudden wave of spot buying combined with the liquidation of short derivative positions. This catalyzed a rapid cascade upward, enabling Bitcoin to pierce the $85,000 ceiling. The session high of $85,174.35 stands not only as a daily peak but as a definitive structural break from the tight trading band that had trapped the asset since January.

Chronology of the Rebound: From January Highs to September Breakout

To fully understand the weight of the September 21 price action, it is necessary to examine the timeline of Bitcoin’s market structure over the past three quarters:

January: Bitcoin reaches local highs following strong early-year momentum, establishing a robust upper boundary that would subsequently define the market’s ceiling for the next eight months.
February through April: As macroeconomic pressures, including persistent inflation data and shifting central bank interest rate expectations, weigh on risk-on assets, Bitcoin enters a prolonged cooling-off period, sliding well below the January peaks.
May through July: The market transitions into a state of low volatility and choppy consolidation. Despite various catalysts, bullish attempts to break out of the established range repeatedly fail near resistance zones, leading to declining trading volumes across major centralized exchanges.
August: Market participants note a gradual tightening of Bollinger Bands on daily and weekly charts, signaling that a high-volatility expansion is imminent. Institutional inflows into regulated crypto investment products begin to stabilize after summer outflows.
Early September: Price action begins to press against the upper limits of the summer range, setting the stage for an imminent test of major psychological resistance.
September 21: Bitcoin definitively pushes through $85,000, printing a session high of $85,174.35 and securing its highest spot price valuation in eight months.

Supporting Data and Market Mechanics

Market data from major spot exchanges and derivatives platforms highlights the dual-engine nature of the September 21 rally. On-chain metrics reveal a steady accumulation trend by long-term holders—wallets holding Bitcoin for over 155 days—continuing unabated even during the summer consolidation phase. This underlying supply squeeze meant that when fresh capital entered the ecosystem, the pool of liquid coins available on exchanges was remarkably thin.

Simultaneously, the derivatives market played an amplified role in accelerating the price movement. Open interest across perpetual futures contracts had been building steadily in the days leading up to the breakout. As Bitcoin approached and crossed the $85,000 mark, a concentration of leveraged short positions was forced to liquidate. These automated buy orders compounded the upward trajectory, driving the rapid ascension to $85,174.35.

However, market analysts caution that rallies driven heavily by derivative liquidations can sometimes lack the structural integrity of pure spot-driven demand. Funding rates across major exchanges ticked upward following the breakout, indicating that bullish sentiment was becoming increasingly leveraged. Observers note that while high funding rates reflect strong short-term demand, they also leave the market vulnerable to sharp, sudden flush-outs if overextended positions are forced to unwind.

Industry Perspectives and Analyst Reactions

Reactions from market commentators, quantitative analysts, and digital asset fund managers have been universally attentive, though characterized by a healthy dose of pragmatism.

Veteran market analysts pointed out that while reclaiming an eight-month high is psychologically significant, it does not automatically rewrite the broader macro picture. "Crossing a round number like $85,000 is a fantastic headline for retail sentiment, but the real work begins when the market has to digest the supply resting above that level," noted a senior strategist at a digital asset research firm. "The difference between a transient volatility spike and a sustainable structural shift lies in price acceptance—specifically, whether the market is willing to trade sideways or higher above the breakout point for an extended period."

Other commentators emphasized the role of institutional infrastructure in supporting the current market cycle. Unlike previous retail-dominated surges, the modern Bitcoin ecosystem features deep derivatives markets, regulated custody solutions, and publicly traded investment vehicles that allow institutional capital to enter and exit with greater efficiency. This institutional backing has arguably cushioned the downside throughout the year, preventing deeper corrections and establishing a higher structural floor for the asset.

Broader Impact and Implications for the Digital Asset Ecosystem

The breaching of the $85,000 threshold carries broader implications for the wider cryptocurrency sector. Historically, a decisive upward move in Bitcoin—often resulting in an expansion of its market dominance—serves as a bellwether for the entire digital asset class. Altcoins, decentralized finance (DeFi) tokens, and layer-1 blockchain assets frequently take their directional cues from Bitcoin’s macro trends.

If $85,000 successfully transitions from a rigid ceiling to a reliable support floor, it could unlock renewed risk appetite across the broader ecosystem. Capital rotation from Bitcoin into high-cap altcoins is a well-documented historical phenomenon that often follows sustained Bitcoin breakouts. Conversely, if the market experiences a sharp rejection and falls back beneath the eight-month range, it could reinforce the validity of the existing consolidation channel, postponing any extended bull market thesis until late 2026 or beyond.

Furthermore, the psychological impact on retail investors should not be underestimated. Extended bear or consolidation markets often lead to user fatigue and diminished engagement across decentralized applications and trading platforms. By punching through to an eight-month high, Bitcoin injects renewed vitality into the public discourse surrounding cryptocurrency, attracting fresh attention from both retail participants and traditional financial media outlets.

Looking Ahead: The Crucial Test at $85,000

As trading sessions progress following the September 21 milestone, all eyes remain fixed on price action around the $85,000 mark. Market participants are monitoring volume profiles, order book depth, and daily candle formations to determine whether buyers can defend the newly established range.

The immediate technical challenge is twofold: sustaining spot demand to absorb remaining profit-taking from long-term holders, and avoiding a cascade of long liquidations if leveraged traders become overly aggressive. Whether this breakout goes down in history as the catalyst for a sustained upward trend or merely as a fleeting volatility event within a persistent range will be decided by how the market behaves in the days to come. For now, Bitcoin has decisively redrawn its boundaries, putting a price level back on the board that had been absent for the entirety of the year’s opening chapters.

September 21, 2026 0 comment
0 FacebookTwitterPinterestEmail
Bitcoin & Core Networks

Bitcoin Enters Historical Dollar-Cost Averaging Zone as Market Sentiment Shifts to Fear and Accumulation

by Evan Lee Salim September 21, 2026
written by Evan Lee Salim

The landscape of the digital asset market has shifted dramatically, moving away from the palpable euphoria that characterized earlier periods toward a state of heightened caution and strategic positioning. Bitcoin, the world’s leading cryptocurrency by market capitalization, has officially transitioned into a well-documented Dollar-Cost Averaging (DCA) zone. This specific structural region has historically emerged during market cycles when prevailing sentiment plummeted to pessimistic lows, quietly laying the groundwork for substantial long-term gains. While short-term volatility and bearish pressures continue to weigh on trader confidence, market analysts point to recurring cyclical patterns that suggest this phase could represent a pivotal accumulation window for institutional and retail investors alike.

The recent evolution of Bitcoin’s price action highlights a departure from the bullish milestones achieved in late 2025, when the asset reached an all-time high above $126,000 following a massive rally from the lows of the 2022 FTX-induced collapse. Currently changing hands around the $62,800 threshold, Bitcoin is testing crucial long-term curved support levels on monthly timeframes. This positioning has drawn intense scrutiny from market observers, who are actively evaluating whether the current environment mirrors the structural setups of past multi-year cycles or if deeper macro headwinds will force a more prolonged consolidation period.

Historical Parallels: Examining the 2019 and 2022 Accumulation Phases

To understand the significance of Bitcoin’s current price behavior, market historians frequently look back at structural analogues from previous halving cycles. The overarching narrative of the cryptocurrency market has routinely followed a predictable emotional arc: extreme highs are followed by systemic disbelief, widespread declarations that the asset is "dead," and the eventual formation of a deep DCA accumulation channel that precedes the next parabolic breakout.

Bitcoin Price Just Entered The DCA Zone That Has Previously Triggered A 2,200% Rally To ATH | Bitcoinist.com

In 2019, Bitcoin experienced a profound cooling-off period following its late-2017 peak of approximately $19,000. That cycle saw the asset endure an 83% drawdown, plunging deep into a depressed accumulation range where market participation dwindled and retail interest faded. Despite the bleak macro outlook at the time, that exact DCA zone formed the foundation for the subsequent bull run that culminated in the 2021 all-time high of roughly $69,000.

A structurally identical, albeit compressed, timeline unfolded in the wake of the November 2022 FTX exchange collapse. Forced liquidations and cascading counterparty failures dragged Bitcoin down to a cycle low of approximately $15,500. Yet, steadfast market participants who utilized the lower pricing tiers to accumulate assets were rewarded with a nearly 600% rally. This upward trajectory breached the $100,000 psychological milestone and eventually drove BTC to fresh record highs above $126,000 in October 2025.

Crypto analyst Ardizor recently highlighted these historical similarities in a widely discussed post on X (formerly Twitter), noting that current market conditions bear an uncanny resemblance to the pre-recovery phases of past cycles. The recurrence of this pattern suggests that market psychology remains remarkably consistent, driven by alternating waves of speculative mania and debilitating fear.

Current Market Dynamics and On-Chain Realities

Despite the encouraging historical context provided by long-term monthly charts, the immediate market environment presents a complex mixture of bullish accumulation and persistent bearish headwinds. Bitcoin is currently trading near $62,800, successfully respecting the long-term curved support line that underpins the bull thesis. However, the path forward is complicated by shifting liquidity dynamics, institutional exchange-traded fund (ETF) flows, and underlying on-chain metrics.

Bitcoin Price Just Entered The DCA Zone That Has Previously Triggered A 2,200% Rally To ATH | Bitcoinist.com

Recent data indicates that capital is selectively flowing out of the network, tempering the aggressive buying momentum observed earlier in the cycle. Specifically, Bitcoin’s Realized Cap—a metric that values each unspent transaction output (UTXO) at the price it last moved on-chain—has experienced a decline of roughly $12 billion from its peak in mid-May. This contraction reflects a reduction in aggregate capital stored within the network, signaling that profit-taking and capital flight have outpaced fresh inflows in the short term.

Furthermore, evaluations of Bitcoin’s Profit and Loss (PnL) Index suggest that the asset has not yet definitively signaled an absolute cycle bottom. Instead, quantitative market models position BTC within a transitional phase. Analysts note that while the market may experience additional downside or prolonged sideways chop before establishing a final structural floor, this intermediate uncertainty does not invalidate the DCA thesis. In fact, historical analysis shows that the 2019 and 2022 accumulation zones rarely materialized under calm, bullish conditions; rather, they formed precisely when market liquidity was thin, macroeconomic fears were elevated, and the broader trading community anticipated a deeper correction.

Institutional Perspectives and Macroeconomic Influences

The interplay between institutional participation and macroeconomic policy continues to dictate the broader trajectory of the digital asset sector. Coinbase executives and various institutional market makers have repeatedly characterized prolonged market downturns and lower price tiers as a structural "discount" window for sovereign wealth funds, corporate treasuries, and institutional allocators. As traditional financial institutions increasingly integrate digital assets into diversified portfolios through spot ETFs and regulated custody solutions, the nature of market cycles has begun to evolve.

While retail sentiment often oscillates violently between extreme greed and capitulation-driven fear, institutional entities frequently approach multi-year cycles with a long-term horizon, favoring disciplined, systematic accumulation strategies like Dollar-Cost Averaging. This divergence in market behavior helps explain why Bitcoin can simultaneously experience institutional accumulation while suffering from retail-driven sell pressure and negative ETF net flows on a week-to-week basis.

Bitcoin Price Just Entered The DCA Zone That Has Previously Triggered A 2,200% Rally To ATH | Bitcoinist.com

Macroeconomic factors, including central bank monetary policies, global liquidity indices, and shifting regulatory frameworks across major economies, further complicate the outlook. As inflationary pressures and shifting interest rate expectations influence global risk assets, Bitcoin occupies a unique dual role as both a high-beta growth asset and an emerging decentralized monetary network. The resilience of the asset’s long-term support structure amidst these shifting macroeconomic currents will likely determine whether the current consolidation phase resolves into a sustained upward trend or a prolonged period of range-bound trading.

Implications for Market Participants

The transition of Bitcoin into a historical DCA zone carries distinct implications for different classes of market participants. For short-term leveraged traders, the prevailing transition phase and lack of immediate upside euphoria introduce heightened volatility risks, requiring strict risk management and capital preservation strategies. The decline in Realized Cap and the transitional readings of the PnL Index serve as empirical reminders that downside risks remain present, and a definitive bottoming signal has yet to be fully printed across all on-chain metrics.

Conversely, for long-term investors adhering to systematic investment strategies, the current price region offers structural parallels to previous accumulation zones that ultimately preceded historic bull markets. By focusing on multi-year timeframes rather than day-to-day market noise, these participants view the prevailing fear and market apathy as necessary components of a healthy market cycle reset.

As Bitcoin continues to test its crucial curved support level around the low-$60,000 range, the coming weeks and months will test the resolve of the market. Whether the current environment serves as the launching pad for the next major leg of the secular bull market or requires an extended consolidation phase remains to be seen. What is clear, however, is that the fundamental dynamics governing Bitcoin’s multi-year market cycles continue to operate with remarkable consistency, rewarding patience, discipline, and data-driven perspective over emotional reaction.

September 21, 2026 0 comment
0 FacebookTwitterPinterestEmail
Ethereum & Smart Contracts

Ethereum Protocol Roadmap 2026-2029: Securing the Future of Decentralized Finance

by Raul Delapena Setiawan September 21, 2026
written by Raul Delapena Setiawan

In May 2026, the Ethereum Foundation (EF) Protocol cluster initiated a significant restructuring, appointing three new cluster coordinators to lead the network’s technical evolution. Following months of internal alignment with developers across the broader Ethereum ecosystem, the team has now formally unveiled its strategic roadmap for the period spanning through December 2029. This roadmap is centered on a singular, ambitious objective: achieving comprehensive quantum resistance across the execution, consensus, and data layers of the Ethereum L1 network.

The Strategic Imperative: The Quantum-Resistant North Star

The primary driver of this long-term strategy is the looming threat of "Q-day"—the point at which quantum computers become powerful enough to break existing cryptographic standards. By setting a hard deadline of December 2029, the Ethereum Foundation is preemptively aligning itself with the migration timelines established by global technology leaders, including Google, Cloudflare, and Microsoft. While the exact date of Q-day remains a subject of debate among physicists and cryptographers, the EF has adopted a "deliberately aggressive" planning assumption that the network must be fully hardened by 2030.

This commitment is not merely a technical choice but a strategic one. By committing to this timeline, the Ethereum Foundation aims to signal the long-term viability and security of the network to institutional participants and individual users alike. This self-imposed deadline will remain non-negotiable until at least January 2027, at which point the EF intends to perform a comprehensive reassessment of the quantum computing landscape, guided by external subject matter experts.

Chronology of the Hegota Scoping Season

The current phase of development, dubbed the "Hegota" scoping season, represents a departure from previous, more fragmented upgrade cycles. This season was defined by a rigorous, evidence-based process involving approximately 60 researchers and engineers. The workflow included the evaluation of 62 distinct Ethereum Improvement Proposals (EIPs), extensive retrospective analysis of the upcoming "Glamsterdam" mainnet launch, and the utilization of 16 specialized contribution templates.

This process was designed to synthesize a shared set of priorities, establishing a critical path that connects immediate, near-term upgrades to the 2029 quantum-readiness milestone. Following the expected completion of Glamsterdam in late 2026, the roadmap dictates a rapid-fire delivery schedule. To meet the 2029 target, the foundation projects an average cadence of approximately 7.2 months per hard fork, a pace that requires unprecedented coordination between client teams and the core research community.

Minimum Viable Post-Quantum (MV-PQ) Milestones

A key component of this transition is the introduction of a Minimum Viable Post-Quantum (MV-PQ) milestone, scheduled for the "J*" fork. This milestone serves as a critical contingency, designed to ensure the network remains operational during a quantum transition even if the full suite of security guarantees is not yet finalized.

While the ultimate target remains full post-quantum readiness across all layers, the MV-PQ approach prioritizes essential functions:

  • Consensus Layer: Implementation of a post-quantum "heartbeat."
  • Data Layer: Deployment of "leanDA" sampling techniques.
  • Execution Layer: Integration of "leanSPHINCS" transaction structures.

This phased rollout allows the network to maintain a reduced but functional security posture while researchers continue to refine the more complex requirements, such as post-quantum attestations necessary for total economic finality.

Research Arcs: The Engines of Innovation

To manage the complexity of this multi-year transition, the Protocol cluster has organized its efforts into five distinct, parallel research arcs. These arcs ensure that immediate fork-delivery needs do not stifle long-term architectural improvements.

  1. Fast Finality: Aimed at reducing Ethereum’s time-to-finality from the current multi-minute window to a matter of seconds. This involves a fundamental decoupling of finality from block production.
  2. Post-Quantum: The overarching framework for the 2029 transition. This arc emphasizes cryptographic agility in the execution layer, enabling the replacement of signature schemes without requiring constant, disruptive hard forks.
  3. Privacy: Focused on establishing privacy as a core protocol guarantee. Initial efforts under the Hegota umbrella target trustless, censorship-resistant private transactions, with future goals including the development of encrypted mempools.
  4. State: Targeted at mitigating state bloat and ensuring sustainable access to historical data. This work involves migrating to a new trie structure and optimizing how validators store and retrieve state.
  5. zkEVM: A long-term shift toward mandatory execution proofs. By requiring validators to verify succinct proofs rather than re-executing every block, Ethereum expects to drastically increase its efficiency and formal verifiability.

The Priority Ladder and Operational Shifts

The shift toward a post-quantum mandate has necessitated a reordering of internal priorities. The foundation has transitioned from a focus on general scalability and stability to a rigid, tiered structure. Under the post-Glamsterdam priority ladder, "Keeping Mainnet Safe" remains the top-tier (P0) priority. However, the secondary (P1) tier has been explicitly redefined to focus on the critical path of the Hegota, I, and J forks—the primary delivery vehicles for MV-PQ.

This shift signifies a maturation in the development pipeline. The lifecycle from research to mainnet is now strictly governed by a maturity pipeline: Research → EIP → Prototype → Devnet → Pre-Final Implementation (PFI) → Candidate Final Implementation (CFI) → Stable Final Implementation (SFI) → Mainnet. Each stage is intended to reduce uncertainty, with the requirement that each proposal provides empirical evidence before advancing.

Focus on Hegota: FOCIL and Frame Transactions

As the immediate next step, the Hegota fork is the first test of this refined scoping process. The primary objective for Hegota is not to be a "quantum fork," but to ensure that the infrastructure is in place for the subsequent quantum-ready forks to proceed on schedule.

The two headlining EIPs for Hegota are:

  • EIP-7805 (FOCIL): Fork-choice enforced Inclusion Lists, which empower validators to impose constraints on builders, directly addressing concerns regarding censorship and capture resistance.
  • EIP-8141 (Frame Transaction): A new transaction model that supports native account abstraction. This allows for programmable validation and fee payment, significantly hardening the network against common attack vectors and facilitating the retirement of vulnerable secp256k1 keys.

The Protocol cluster has signaled that it has "little appetite" for additional consensus-layer scope for Hegota. Every additional item added to the fork represents a diversion of resources away from the critical path toward the 2029 quantum-readiness goal.

Broader Implications and Industry Impact

The decision by the Ethereum Foundation to publicly commit to a specific 2029 deadline for quantum resistance reflects a broader trend in the blockchain industry. As cryptographic threats evolve, leading L1 protocols are increasingly forced to prioritize long-term security over short-term feature development.

Industry analysts suggest that this roadmap could provide a template for how other decentralized networks handle the "quantum transition." By decoupling the execution and consensus layers and implementing cryptographic agility, Ethereum is positioning itself to be more resilient to future technological disruptions. However, the success of this strategy rests entirely on the ability of the global community of developers, grant recipients, and researchers to maintain the required 7.2-month fork cadence.

Engagement and Public Transparency

Recognizing the scale of this undertaking, the Ethereum Foundation has emphasized transparency. To facilitate community understanding, the foundation has released a companion post, "EF Protocol: The Hegota EIP Opinion Post and Tier List," which provides a granular breakdown of how each proposed EIP was graded. Furthermore, the foundation is hosting a community-wide Reddit AMA on September 16, 2026, to address technical questions regarding the roadmap and the specific trade-offs inherent in the Hegota scoping.

As Ethereum moves into this new, highly structured era of development, the message from the Protocol cluster is clear: the path to 2029 is a marathon, not a sprint, and every fork is a critical, measured step toward securing the network for the next century of decentralized activity.

September 21, 2026 0 comment
0 FacebookTwitterPinterestEmail
Bitcoin & Core Networks

Ethereum Price Surge Above $2,631 Support Sparks Optimism as Bulls Target $3,520 Amid Strong Q3 Performance

by Basiran September 21, 2026
written by Basiran

Ethereum (ETH), the world’s leading smart contract platform and second-largest cryptocurrency by market capitalization, has captured the attention of financial markets and digital asset traders alike following a decisive breakout above a crucial short-term consolidation zone. As trading desks evaluate recent price action, ETH is maintaining bullish momentum comfortably above the critical $2,631 support level, with technical configurations and volume profiles pointing toward a potential continuation rally targeting the $3,520 threshold.

According to market data provided by Brave New Coin, Ethereum recently climbed past the $2,650 threshold, stabilizing near the $2,667 mark while registering a solid 3.37% gain over a 24-hour trading window. This upward movement represents a definitive breakout from a persistent short-term consolidation pattern that had constrained price action between the $2,550 and $2,600 regions for several sessions. As buyers successfully breach these overhead barriers, analysts and institutional market participants are increasingly focusing on the macro implications of this technical shift, assessing whether current market fundamentals can sustain a prolonged upward trajectory heading into the final stretch of the third quarter of 2026.

Ethereum (ETH) Price Prediction: ETH Breaks Higher as $2,631 Support Puts $3,520 Target in Focus

Technical Analysis and the Bullish Flag Setup

The mechanics driving Ethereum’s latest price appreciation are rooted in classical technical analysis, specifically a breakout from a well-defined short-term bullish flag pattern. Following an earlier sharp impulsive rally earlier in the quarter, Ethereum entered a corrective consolidation phase characterized by sideways movement and declining volume. This price compression typically precedes a continuation of the primary trend, a dynamic that played out when aggressive buyers penetrated the upper boundary of the flag formation.

Market analyst Celal Kucuker highlighted the significance of this structural breakout on social media platform X, emphasizing that the setup mimics classical continuation patterns observed during robust market recoveries. By calculating the height of the preceding flagpole and projecting it upward from the breakout point, technical forecasts map a potential 37.06% price expansion. This calculation places Ethereum’s ultimate measured-move target at approximately $3,520.79.

However, professional traders note that reaching this ambitious milestone remains conditional upon the preservation of the current market structure. Maintaining a price floor above the former flag resistance is essential for validating the continuation thesis. Conversely, a failure to hold these gains and a subsequent drop back inside the consolidation channel would invalidate the immediate bullish setup, exposing the asset to extended range-bound trading. Furthermore, even with a favorable technical configuration, ETH must successfully overcome several intermediary psychological and structural resistance barriers before threatening the $3,500 psychological zone.

Ethereum (ETH) Price Prediction: ETH Breaks Higher as $2,631 Support Puts $3,520 Target in Focus

Volume Profile Analysis and the Significance of the $2,631 Point of Control

Beyond traditional chart patterns, volume-profile analytics provide vital context regarding Ethereum’s structural health. The asset’s Point of Control (POC)—the specific price level where the highest volume of trading activity has occurred over the analyzed range—is firmly established near the $2,631 mark.

Prominent crypto market analyst CW8900 emphasized the importance of this region following Ethereum’s broad market recovery. With ETH hovering above this threshold, the $2,631 POC transforms from an area of historical interest into a robust volume-based support shelf situated directly beneath current market prices. This high-volume node serves as a primary line of defense for market bulls.

During any short-term retracements or profit-taking phases, market participants will closely monitor how price action reacts upon retesting the $2,631 zone. Defending this volume cluster signals that buyers are willing to absorb selling pressure and accumulate assets at higher valuations. On the other hand, a decisive breakdown below the Point of Control would likely shift market sentiment toward caution, potentially dragging ETH back down toward broader foundational liquidity zones clustered between $2,600 and $2,550.

Ethereum (ETH) Price Prediction: ETH Breaks Higher as $2,631 Support Puts $3,520 Target in Focus

Market Sentiment and Accumulation Strategies on Pullbacks

The psychological landscape surrounding Ethereum has grown increasingly constructive, marked by a pervasive buy-the-dip mentality among mid-to-long-term investors. Rather than succumbing to panic during minor market corrections, institutional and retail participants alike are utilizing shallow pullbacks as tactical accumulation windows.

Analyst Crypto_Scient shared insights regarding Ethereum’s higher-timeframe market structure, noting that ongoing demand continues to outpace localized selling pressure. While some conservative projections outline a deeper corrective scenario toward the $2,150 region as a generational buying opportunity over the coming weeks, current price action demonstrates that buyers are aggressively supporting higher lows.

This resilience indicates a maturation of market participants holding ETH, who increasingly view short-term volatility as part of a broader structural recovery. By shaking out leveraged long positions during previous liquidation flushes, the market has established a healthier foundation for sustainable growth, minimizing the risk of cascading liquidations that have historically hampered sharp rallies.

Ethereum (ETH) Price Prediction: ETH Breaks Higher as $2,631 Support Puts $3,520 Target in Focus

Historical Performance Context and Q3 Seasonality

Ethereum’s recent price dynamics are further reinforced by impressive quarterly performance metrics that underscore the asset’s cyclical strength. Market analyst BitBull published comparative data illustrating that Ethereum has achieved a remarkable return of approximately 67.57% throughout the third quarter of 2026.

This performance slightly outpaces the robust 65.55% return recorded during the corresponding third quarter of 2025. Should these gains hold through the official quarter-end close, Ethereum will secure its strongest third-quarter performance within the comparative multi-year dataset. Seasonal tailwinds, combined with renewed capital inflows into decentralized finance (DeFi) protocols and layer-2 scaling solutions, have historically provided a favorable backdrop for ETH during this period of the calendar year.

The intersection of strong macroeconomic sentiment within the broader digital asset ecosystem and Ethereum’s specific on-chain metrics has created an environment where momentum indicators remain biased toward the upside. Analysts tracking derivatives markets also point out that open interest has stabilized following previous deleveraging events, reducing systemic risk and allowing spot-driven demand to dictate the pace of the current advance.

Ethereum (ETH) Price Prediction: ETH Breaks Higher as $2,631 Support Puts $3,520 Target in Focus

Broader Implications and Outlook for the Weeks Ahead

As Ethereum continues to consolidate its position above the $2,631 support level—recently trading near $2,748 with a 4.41% increase over a 24-hour period—the path of least resistance appears tilted toward further appreciation. The immediate hurdles for market bulls involve establishing a firm footing above $2,700, which would clear the runway for a test of the $2,800 resistance zone and the pivotal psychological threshold of $3,000.

The broader macroeconomic environment, characterized by shifting monetary policy expectations and fluctuating institutional appetite for spot crypto exchange-traded products, will continue to play a deterministic role in shaping Ethereum’s trajectory. If capital continues to rotate into foundational layer-1 blockchain assets, Ethereum is well-positioned to capture a significant share of this liquidity.

Ultimately, while the technical target of $3,520 remains the primary objective for bullish market participants, risk management remains paramount. Traders and investors will maintain a vigilant watch over the $2,631 Point of Control. Sustained defense of this high-volume node will validate the current breakout and signal readiness for the next leg higher, whereas a failure to hold this threshold would necessitate a reassessment of the near-term timeline for Ethereum’s continued market expansion.

September 21, 2026 0 comment
0 FacebookTwitterPinterestEmail
Ethereum & Smart Contracts

Ethereum Faces Bearish Price Pressure While On-Chain Activity and Institutional Accumulation Reach Historic Highs

by Ammar Sabilarrohman September 21, 2026
written by Ammar Sabilarrohman

The cryptocurrency market is currently navigating a period of pronounced bearish sentiment, with Ethereum (ETH), the world’s leading altcoin and foundational smart contract platform, bearing a substantial share of downward pressure. As market values slip and key technical supports are repeatedly tested, analysts are warning that ETH could retest the $1,500 threshold, or even explore deeper historical valuation floors. However, this downward price action presents a striking paradox. Beneath the subdued surface of spot prices, the Ethereum network is experiencing an unprecedented surge in organic usage, developer engagement, and long-term investor accumulation. On-chain metrics, exchange reserve depletions, and structural adoption indicators suggest that the underlying health of the Ethereum ecosystem has never been stronger, even as short-term traders grapple with macroeconomic headwinds and persistent volatility.

Main Facts and Current Market Dynamics

Ethereum’s price action over recent weeks has tested the patience of retail and institutional holders alike. As bearish momentum builds across the broader digital asset landscape, ETH has gravitated toward crucial support levels, hovering near the $1,600 mark with potential structural targets pointing toward $1,500. This downward trajectory reflects a broader cooling-off period following cyclical peaks, driven by macroeconomic tightening, shifting risk appetites, and compressed liquidity across global financial markets.

Yet, this price contraction stands in stark contrast to the network’s operational reality. While token valuations have stagnated, the underlying blockchain infrastructure is busier than ever. Data compiled by prominent market researchers indicates that daily active addresses, transaction volumes, and total value locked (TVL) across layer-1 and layer-2 scaling solutions are breaking historical records. Rather than fleeing the ecosystem during a downturn, users, developers, and institutional entities are actively leveraging Ethereum’s capabilities for decentralized finance (DeFi), real-world asset (RWA) tokenization, and complex smart contract execution.

Ethereum Ecosystem Milestone: On-Chain Activity Across The Network Explodes To Historic Levels |

Chronology of Network Growth and Adoption

To fully appreciate the scale of Ethereum’s current network activity, it is instructive to examine the historical trajectory of its user base across successive market cycles. During the 2018 bear market—a period colloquially known as the "crypto winter"—daily active wallet addresses on the Ethereum network peaked at approximately 720,000. As the market matured and entered the explosive bull run of 2021, driven by the rise of DeFi and non-fungible tokens (NFTs), daily active addresses reached a new high-water mark of roughly 800,000.

In the current market cycle spanning 2025 and 2026, those historical peaks have been decisively shattered. On-chain data reveals that daily active addresses on Ethereum have consistently pushed past the 1 million threshold, with periodic spikes peaking above 1.3 million. This sustained increase demonstrates that the network is currently processing significantly more organic, day-to-day activity than it did during the height of the 2021 speculative frenzy. This structural evolution illustrates that Ethereum has successfully transitioned from a speculative retail play into an entrenched global settlement layer and economic engine.

Supporting Data: Supply Shock and Exchange Depletions

Perhaps the most compelling argument against the prevailing bearish narrative is the aggressive withdrawal of ETH from centralized cryptocurrency exchanges. According to reports shared by Leon Waidmann, Head of Research at Lisk, the total balance of Ethereum held on centralized trading platforms has plummeted to historic lows.

As of recent data, exchange reserves have dwindled to approximately 14.5 million ETH. To contextualize this decline, exchange balances sat at roughly 21 million ETH in October 2023. Over the span of roughly two and a half years, over 6 million ETH—valued at billions of dollars—have been systematically pulled off exchanges and moved into private wallets, cold storage, staking contracts, and institutional custody solutions.

Ethereum Ecosystem Milestone: On-Chain Activity Across The Network Explodes To Historic Levels |

Historically, periods of heightened market volatility and downward price pressure are characterized by a surge of inflows into centralized exchanges as panic-driven investors position themselves to liquidate holdings. However, the current cycle has inverted this trend entirely. The steady, relentless outflow of coins indicates a strong conviction among buyers. As Waidmann succinctly noted in his market commentary, "Whoever is buying here isn’t selling back." This supply squeeze heavily restricts the liquid circulating supply available for immediate spot trading, laying the groundwork for a potential supply-side shock once buying demand returns to the market.

Analytical Perspectives on Price Bottoms and Valuation Metrics

While long-term fundamentals present an overwhelmingly bullish picture for network utility and supply distribution, short-term technicians and quantitative analysts continue to evaluate where the absolute macro bottom for ETH’s price might lie. A recent valuation framework shared by crypto analyst Ali Charts utilizes the Ethereum Delta Price metric to pinpoint historical market bottoms.

The Delta Price metric is a specialized on-chain indicator that calculates the difference between the average price at which all coins were last moved on-chain (investor cost basis) and the aggregated cost of production (miner/validator economics). Historically, this metric has proven remarkably accurate in identifying deep accumulation zones and ultimate cycle troughs for Ethereum.

Following a comprehensive analysis of the Delta Price model, Ali Charts highlighted that Ethereum’s structural bottom could theoretically reach as low as $700 under extreme macro stress conditions. While a drop to $700 would represent a severe drawdown from current levels, analysts emphasize that such historical flushes often serve as the ultimate springboard for multi-year secular bull markets. Whether ETH undergoes a sharp wick down to these historical value floors or establishes a higher low above $1,500 depends heavily on external macroeconomic catalysts and broader liquidity inflows into the digital asset class.

Ethereum Ecosystem Milestone: On-Chain Activity Across The Network Explodes To Historic Levels |

Broader Impact and Market Implications

The divergence between Ethereum’s depressed price action and its record-breaking network activity carries profound implications for the broader blockchain industry. On one hand, short-term investors facing unrealized losses may feel disconnected from the optimistic narrative of on-chain growth. The prospect of retesting lower support levels or navigating prolonged consolidation can dampen speculative enthusiasm.

On the other hand, the institutionalization and deep-pocketed accumulation occurring behind the scenes signal a mature market transition. Large funds, corporate treasuries, and sophisticated market participants are treating the current price weakness as a generational accumulation phase. By removing millions of ETH from liquid circulation through staking and long-term cold storage, these entities are systematically reducing market elasticity.

Furthermore, Ethereum’s unwavering status as the preeminent settlement layer for decentralized applications ensures its continued relevance regardless of short-term price volatility. As layer-2 networks absorb high-frequency transactions and lower gas fees for everyday users, the mainnet continues to secure billions of dollars in economic value daily.

Ultimately, the current phase of the Ethereum market cycle highlights a classic tension between short-term price sentiment and long-term fundamental adoption. While traders brace for potential volatility and the possibility of testing deeper support zones, the structural pillars supporting the Ethereum ecosystem—ranging from unprecedented active address counts to historic exchange supply drains—suggest that the network is building a formidable foundation for its next major historical expansion.

September 21, 2026 0 comment
0 FacebookTwitterPinterestEmail
DeFi (Decentralized Finance)

Synthetix Launches Native Multicollateral Margin on Ethereum Mainnet, Enabling Traders to Use Ether as Collateral Without Selling Their Holdings

by Asro September 21, 2026
written by Asro

The decentralized finance landscape on Ethereum Mainnet experienced a significant structural evolution today with the official rollout of multicollateral margin on Synthetix, introducing Ether (ETH) as the protocol’s first non-stablecoin collateral asset. For the first time in the history of the Ethereum network, traders can deposit native ETH to serve as direct collateral for perpetual swaps (perps) without ever needing to liquidate their core asset holdings. Operating entirely on Ethereum Layer 1, the new system aims to bridge the gap between long-term holding strategies and active derivatives trading, unlocking billions of dollars in idle capital across the ecosystem.

Background Context and Evolution of Synthetix Margining

To understand the weight of this development, it is necessary to examine the historical constraints of decentralized perpetual exchanges. Historically, the vast majority of decentralized derivatives platforms—particularly those handling high-frequency trading or complex order books—relied strictly on stablecoins such as USDT or USDC for margin and settlement. While stablecoins mitigate volatility risks during margin calculations, they force traders who are fundamentally bullish on volatile assets like ETH to either sell their holdings or utilize wrapped, third-party lending protocols to borrow liquidity, introducing smart contract fragmentation, bridge risks, and liquidation friction.

Synthetix has long positioned itself as a foundational liquidity layer native to Ethereum Mainnet. By anchoring its trades, settlements, and liquidity pools directly to the Layer 1 network, the protocol sought to build a more secure, trust-minimized trading environment. However, the limitation of accepting only USDT for margin constrained capital efficiency. Traders who held significant ETH stacks had to execute taxable events or incur opportunity costs by parting with their primary digital assets to participate in derivatives markets.

The introduction of multicollateral margin marks the culmination of months of protocol engineering and smart contract auditing. By bridging the gap between an investor’s long-term conviction in ETH and their short-term trading strategies, Synthetix has systematically removed one of the most prominent friction points in decentralized derivatives trading.

Mechanics of Native ETH Margin: How the System Operates

Introducing ETH as Margin on Synthetix

Under the newly deployed architecture, users can deposit ETH directly into a unified multicollateral margin account on Ethereum Mainnet. Rather than forcing separate accounts for different asset types, the system aggregates a trader’s collateral pool, allowing ETH and USDT to function cooperatively behind the scenes.

When a user deposits ETH, the protocol calculates its real-time value using live oracle index prices. To account for potential market volatility, the system applies a risk discount—commonly referred to as a "haircut"—to the asset. The resulting figure is designated as the user’s Collateral Value, which dictates the precise borrowing and margin capacity of the account.

Because Synthetix perpetual markets are denominated and settled in USDT, trading fees, funding payments, and realized profit and loss (PnL) continue to be settled in the stablecoin. Consequently, if a trader opens positions utilizing ETH collateral without maintaining an active USDT balance, their account’s USDT balance can temporarily dip into a negative figure. This negative balance is intentionally engineered to be fully backed by the underlying ETH collateral. Users retain the flexibility to clear this deficit at any time by utilizing the protocol’s integrated swap feature to convert a portion of their deposited ETH directly into USDT within their unified account dashboard.

To safeguard protocol solvency, the system continuously monitors account health. Because ETH is subject to price fluctuations, a sudden downward market movement in Ether’s spot price will compress the account’s margin buffer, even if the trader’s open perpetual positions remain flat. If a user’s USDT debt exceeds the platform’s established risk limits, automated protocol mechanisms are designed to liquidate a fraction of the deposited ETH to cover the deficit. Protocol developers strongly encourage active traders to monitor their collateral ratios closely and manage their buffers proactively to avoid automated intervention.

Unlocking DeFi Efficiency: The Rise of Optimized Basis Trades

The deployment of ETH as multicollateral margin is expected to profoundly impact institutional and advanced retail trading strategies within decentralized finance, most notably the execution of basis trades. The basis trade—a cornerstone strategy in traditional finance and mature crypto markets—involves going long on a spot asset while simultaneously opening an equivalent short position in the perpetual futures market to capture yield from positive funding rates.

Previously, executing a delta-neutral basis trade on-chain required navigating complex multi-step processes across distinct lending markets and derivatives venues, exposing traders to fragmentation and operational overhead. With Synthetix’s unified account structure, a trader can deposit ETH as collateral and open a matching short ETH perpetual position within the exact same interface.

Introducing ETH as Margin on Synthetix

The collateral value of the ETH and the PnL of the short perpetual position move in inverse directions, effectively neutralizing directional price exposure while allowing the trader to continuously collect funding rate payments. Financial analysts note that as basis trading becomes frictionless on Layer 1, market participants will be able to supply deeper liquidity more efficiently, leading to tighter bid-ask spreads and more competitive pricing for all users on the exchange.

Tapping into Billions in Idle Capital

Industry observers have highlighted the vast macroeconomic implications of opening Layer 1 derivatives liquidity to native assets. With well over $100 billion in circulating ETH residing across wallets, staking contracts, and decentralized applications, the potential addressable market for Synthetix is immense. By providing utility for ETH directly on the Ethereum layer where network security is highest, the protocol has established a foundation for unprecedented capital composability.

Core developers and ecosystem stakeholders have set ambitious milestones for the platform. Market analysts suggest that capturing even a modest single-digit percentage of the broader crypto derivatives market volume could trigger a powerful economic flywheel for the Ethereum ecosystem. Increased trading volume inherently drives higher fee generation, deeper liquidity, and stronger protocol revenues, reinforcing the value proposition of the entire decentralized finance stack.

Future Roadmap: Beyond ETH and Toward Yield-Bearing Assets

While ETH represents the inaugural non-USDT collateral asset accepted by Synthetix Perps, protocol architects have confirmed that the underlying infrastructure was deliberately designed for expansion. The newly implemented multicollateral framework is modular, laying the technical groundwork to onboard a wide array of additional assets in subsequent updates.

Upcoming iterations of the collateral framework are anticipated to include various tokens, with a particular focus on integrating yield-bearing assets. By allowing users to post interest-generating or staking derivative tokens as margin—thereby earning native yield on their collateral while simultaneously utilizing it to back active derivative positions—Synthetix aims to redefine capital efficiency standards in the decentralized derivatives sector.

Introducing ETH as Margin on Synthetix

Current limitations, including minimum deposit thresholds, maximum account caps, and per-asset risk parameters, are dynamically displayed within the platform’s deposit interface. Protocol governance and engineering teams plan to incrementally scale these caps and introduce new collateral types as the system proves its stability under live market conditions.

Market Implications and Industry Outlook

The launch arrives at a pivotal moment for decentralized exchanges (DEXs), which have continuously vied with centralized counterparties (CEXs) for market share in the derivatives sector. While centralized platforms have historically dominated due to deep liquidity and multi-asset collateral support, decentralized protocols like Synthetix are steadily closing the capability gap through advanced Layer 1 and Layer 2 infrastructure.

By anchoring its operations securely on Ethereum Mainnet and eliminating the requirement to liquidate core holdings, Synthetix is positioning itself as an attractive venue for sophisticated traders seeking self-custody alongside institutional-grade capital efficiency. As the protocol rolls out higher deposit caps and incorporates additional collateral classes in the coming months, the broader crypto community will be watching closely to evaluate how native asset margining influences derivatives volume and market depth across the Ethereum ecosystem.

September 21, 2026 0 comment
0 FacebookTwitterPinterestEmail
NFTs & Digital Collectibles

HP Omen Max 16 Review: A High-Performance Fusion of Mobile Gaming Might and Professional Creative Utility

by Lina Hope September 21, 2026
written by Lina Hope

The modern computing market has long maintained a strict boundary between consumer electronics intended for leisure and heavy-duty workstations designed for industrial production. For decades, professionals requiring intensive computational rendering, 3D modeling, and real-time ray tracing were restricted to austere, heavy, and exorbitantly priced mobile workstations. Conversely, high-end gaming laptops prioritized raw frame rates and aggressive aesthetic choices, often alienating academic and corporate environments. However, the release of the HP Omen Max 16 challenges this dichotomy, offering a dual-purpose mobile platform equipped with bleeding-edge hardware designed to bridge the gap between high-fidelity gaming and professional-grade digital content creation.

Main Facts and Architectural Breakdown

At the core of the HP Omen Max 16 lies a formidable pairing of enterprise-tier silicon: an Intel Core Ultra 9 275HX processor featuring 24 computing cores, coupled with an NVIDIA GeForce RTX 5080 laptop GPU equipped with 16GB of GDDR7 VRAM. This configuration is supported by 32GB of system RAM and a 1TB NVMe solid-state drive.

Despite packing components that traditionally demand massive cooling apparatuses and thick chassis designs, the Omen Max 16 maintains a surprisingly manageable physical profile. Weighing significantly less than legacy desktop replacements, the machine bridges the portability gap, rivaling the everyday carry weight of popular productivity notebooks like the Apple MacBook Pro.

The HP Omen Max 16 is everything a student laptop shouldn’t be – so why do I recommend it?

Out of the box, the laptop’s aesthetic presents a nuanced identity. While the customizable RGB keyboard backlighting can be programmed to emit vibrant multi-colored light pulses reminiscent of recreational setups, turning off the illumination reveals a sleek, professional black chassis suitable for lecture halls, boardrooms, and client meetings.

Chronology and Technological Evolution

The convergence of gaming hardware and creative workflows has accelerated over the past five cycles of graphics card architectures. Historically, NVIDIA maintained a rigid operational divide by separating its product lines into GeForce drivers optimized for consumer entertainment and Quadro (later NVIDIA RTX Studio) drivers tailored for computer-aided design, animation, and video editing.

By the introduction of the RTX 50-series architecture, NVIDIA refined its driver ecosystem to allow seamless switching between "Gamer Ready" and "Studio" software environments through a streamlined graphical interface. This technological evolution enables users to toggle operational profiles within minutes.

During practical daily evaluations, this capability transforms the workflow of digital artists and game developers. A typical workday can begin in the morning utilizing the Studio drivers for heavy scene manipulation in Blender or complex spatial calculations in Unreal Engine 5, leveraging CUDA and OptiX acceleration. By evening, a user can switch to Gamer Ready drivers to test fully ray-traced builds of demanding titles such as Control Resonant, demonstrating that high-end gaming laptops can transition between high-demand productivity and leisure without hardware bottlenecks.

The HP Omen Max 16 is everything a student laptop shouldn’t be – so why do I recommend it?

Supporting Data and Comparative Market Analysis

To fully understand the market positioning of the HP Omen Max 16, industry analysts look closely at pricing structures and component stratification within HP’s broader catalogue. The top-tier configuration carrying the RTX 5080 and Core Ultra 9 processor launches with a recommended retail price of £2,999, though promotional retail discounts have temporarily positioned the machine at approximately £2,619.

In contrast, lower-tier alternatives within the same product family—such as an Omen 16 variant equipped with an NVIDIA GeForce RTX 5060, an eight-core processor, 16GB of RAM, and 512GB of storage—retail at significantly reduced price points, often hovering around £1,299 during seasonal sales promotions.

While the lower-tier configurations present an attractive financial proposition for budget-conscious consumers, hardware benchmarks highlight critical limitations. The entry-level models typically feature 8GB of VRAM compared to the Max variant’s 16GB. For 3D artists, digital sculptors, and environment designers utilizing modern rendering engines, VRAM capacity acts as a hard ceiling for texture resolution, scene density, and polygon counts. As software ecosystems increasingly rely on massive asset libraries like Megascans and Nanite geometry, hardware limitations encountered in the third or fourth year of an academic or professional career can render lower-spec machines obsolete far faster than their heavily provisioned counterparts.

Economic Implications and Financial Accessibility

The integration of workstation-grade power into a consumer laptop introduces significant economic and ethical considerations, particularly regarding target demographics such as university students and junior designers. High-end computing investments of nearly £3,000 represent a major financial commitment.

The HP Omen Max 16 is everything a student laptop shouldn’t be – so why do I recommend it?

Retail financing structures, including "buy now, pay later" schemes and consumer credit options, frequently obscure the true cost of ownership. Industry watchdogs have noted that representative annual percentage rates (APRs) on retail financing can exceed 44% if promotional zero-interest windows are missed. Consequently, financial advisors and technology commentators urge caution, noting that while premium hardware provides essential longevity for intensive creative pipelines, acquiring such assets through high-interest short-term debt poses substantial financial risks for individuals with limited or fixed incomes.

Broader Industry Impact and Future Outlook

The launch of desktop-replacement laptops like the HP Omen Max 16 signals a broader shift in how hardware manufacturers approach professional computing. As remote work, hybrid educational models, and independent content creation continue to expand, the demand for hardware that eliminates compromise between computational power and physical mobility is at an all-time high.

For students and professionals entering fields such as game development, VFX production, and architectural visualization, the availability of unified systems reduces the necessity of maintaining separate desktop workstations for rendering and portable laptops for basic text processing. However, the premium pricing tier occupied by these devices ensures they remain niche investments aimed at dedicated practitioners whose professional output directly justifies the capital expenditure.

Ultimately, the Omen Max 16 demonstrates that the technological barriers between gaming and professional rendering have effectively vanished. Whether the market will embrace these unified systems as standard educational and professional tools will largely depend on future pricing strategies and the ongoing evolution of mobile thermal management solutions.

September 21, 2026 0 comment
0 FacebookTwitterPinterestEmail
NFTs & Digital Collectibles

Mad Lads: The Cultural Vanguard of the Solana Ecosystem and the Evolution of the Backpack Brand

by Reynand Wu September 21, 2026
written by Reynand Wu

Mad Lads has solidified its position as more than a mere collection of non-fungible tokens, serving instead as the foundational cultural layer for the Backpack ecosystem and a pivotal case study in the evolution of digital identity on the Solana blockchain. Launched during a period of acute uncertainty for the Solana network—following the collapse of FTX and the departure of several high-profile NFT projects—Mad Lads emerged not just as a set of digital collectibles, but as a strategic demonstration of utility, technological integration, and brand resilience. Developed by the team behind Backpack, including industry figures Armani Ferrante and Tristan Yver, the project successfully redirected the narrative of the Solana NFT space, proving that community-driven branding could thrive when coupled with high-level software infrastructure.

The Genesis of a Cultural Phenomenon

To understand the trajectory of Mad Lads, one must first look at the state of the Solana ecosystem in early 2023. The blockchain was undergoing a period of profound introspection. The loss of major blue-chip collections like DeGods and y00ts, which opted to bridge to other chains, left a void in the network’s cultural leadership. When Mad Lads debuted in April 2023, the market was braced for yet another speculative PFP (profile picture) drop. Instead, the team delivered a sophisticated product that leveraged "xNFTs"—executable NFTs that function as portable, interactive applications within the Backpack wallet.

The minting event itself remains a significant chapter in Solana’s history. It was characterized by unprecedented traffic that tested the limits of the network’s infrastructure. To mitigate the risk of automated bot manipulation, the development team implemented a "honeypot" strategy, deploying a decoy minting site that captured over $250,000 in SOL from malicious actors. These funds were subsequently returned to the affected parties, a move that established the team’s commitment to community integrity. This baptism by fire effectively filtered out short-term speculators and coalesced a core group of holders who viewed the project as a long-term stake in the Solana ecosystem’s recovery.

NFT Project Passport: Mad Lads

Chronology of Development and Strategic Milestones

The project’s evolution can be mapped through a series of tactical shifts that transitioned it from a standalone collection to an intrinsic component of a broader financial infrastructure.

  • April 2023: The official launch of the 10,000-piece Mad Lads collection at a mint price of 6.9 SOL. The launch served as the primary marketing vehicle for the Backpack wallet, showcasing its ability to host interactive, code-based assets.
  • December 2023: The collection reached a historic floor price high of 229.425 SOL, reflecting the growing optimism surrounding the Solana network and the increasing utility of the Backpack wallet.
  • January – February 2026: A critical pivot occurred as Backpack formalized its tokenomics. Mad Lads holders were formally integrated into the Backpack ecosystem, receiving an allocation of 1% of the total BP token supply, totaling 10,000,000 tokens. This move bridged the gap between NFT ownership and ecosystem governance.
  • March 2026: The successful launch of the BP token provided a liquidity-backed asset for the community, further anchoring the value of the Mad Lads NFT to the financial health of the Backpack exchange.
  • June 2026: The announcement of "Backpack Securities" signaled a major shift toward traditional financial integration. By bridging tokenized securities with crypto-native infrastructure, the project moved from a digital art focus to a legitimate financial services model, effectively positioning Mad Lads as a "passport" to this future-facing platform.

Market Data and Asset Performance

As of late June 2026, the collection maintains a floor price of approximately 13.66 SOL, equivalent to roughly $1,012 USD. While floor prices fluctuate, the data indicates that Mad Lads has maintained a consistent liquidity profile, distinguishing it from the vast majority of NFT collections that experience rapid abandonment after initial hype.

The correlation between the Backpack exchange’s volume and the floor price of the Mad Lads collection has become increasingly apparent. Unlike other NFT projects that rely on royalties or secondary market trading fees for sustainability, Mad Lads is effectively subsidized by the success of the Backpack product suite. The 10 million BP tokens allocated to holders represent a significant value proposition, effectively transforming the NFTs into dividend-bearing assets within the broader ecosystem.

The Role of Technological Innovation

The technical architecture behind Mad Lads is fundamentally different from standard NFT projects. By utilizing the xNFT standard, the developers moved away from the "static JPEG" model. In the Backpack ecosystem, these NFTs act as gateways. When a user holds a Mad Lad, they are not merely holding an image; they are holding a credential that grants access to specific features within the Backpack interface.

NFT Project Passport: Mad Lads

This integration serves a dual purpose: it incentivizes users to adopt the Backpack wallet as their primary tool for managing digital assets, and it creates a "walled garden" effect that increases the stickiness of the community. Because the software and the culture are developed by the same team, the feedback loop is significantly tighter than in projects where the community must lobby a third-party developer for new features.

Broader Implications for the NFT Industry

The success of Mad Lads carries broader implications for the future of digital collectibles. The project suggests that the era of the "standalone NFT" is effectively ending. In the current market environment, investors and collectors appear to be shifting their capital toward projects that offer vertical integration. Whether through DeFi access, centralized exchange integration, or, in the case of Backpack, the tokenization of real-world assets (RWA), the value of an NFT is increasingly tied to the utility of its parent company.

Furthermore, the integration of tokenized stocks, such as the $SPCX (SpaceX) tokenized asset, demonstrates that the Mad Lads brand is being positioned to survive in a regulatory environment that demands more than just community engagement. By moving toward regulated securities, the Backpack team is creating a bridge between traditional capital markets and the Solana ecosystem. For a Mad Lads holder, this implies a potential long-term hedge: if the NFT market experiences a downturn, the underlying infrastructure—the wallet, the exchange, and the security brokerage—may continue to generate value.

Analysis of Risk and Future Outlook

Despite the project’s achievements, risks remain. The primary vulnerability of Mad Lads is its lack of independence. The value of the collection is almost entirely derived from the execution of the Backpack team. If the exchange encounters regulatory hurdles or if the BP token fails to maintain its utility, the NFT collection would likely experience a sharp devaluation, as its primary "use case" would be compromised.

NFT Project Passport: Mad Lads

Additionally, the transition from a "cool, edgy" community project to a serious financial infrastructure player presents a branding challenge. Maintaining the "Mad Lads" identity—which is inherently informal and internet-native—while operating a sophisticated, institutional-grade securities platform requires a delicate balance.

However, the team’s track record suggests a high level of operational competence. By consistently delivering on product milestones—from the initial mint to the token launch and the subsequent integration of real-world assets—they have earned a degree of "builder trust" that is rare in the crypto space.

Conclusion

Mad Lads stands as a testament to the idea that in the volatile world of Web3, the projects that survive are those that provide tangible infrastructure to their users. It has successfully navigated the transition from a speculative asset to a foundational element of the Solana ecosystem. As the Backpack brand continues to integrate with traditional finance, the Mad Lads collection serves as a cultural anchor, representing the early adopters who fueled the ecosystem’s growth during its most challenging periods. Whether the collection can maintain this relevance as the platform scales remains the defining question for the coming years, but for now, it remains a primary example of how NFTs can evolve into meaningful components of global financial infrastructure.

September 21, 2026 0 comment
0 FacebookTwitterPinterestEmail
Blockchain Technology & Development

IOTA Integrates Pyth Pro to Bring Institutional-Grade Price Feeds and Lower Latency to Layer 1 Developers

by Asep Darmawan September 21, 2026
written by Asep Darmawan

The decentralized oracle network Pyth has officially completed a major architectural upgrade for the IOTA Layer 1 ecosystem, integrating IOTA into Pyth Pro. This next-generation institutional-grade price feed infrastructure aims to provide developers with significantly lower latency, enhanced network reliability, and access to an expansive catalog of more than 3,000 real-time financial data feeds. The transition marks a pivotal operational evolution not only for IOTA-based decentralized applications (dApps) but also for the broader Pyth Network as it phases out its legacy architecture in favor of a commercially sustainable, high-performance distribution model.

Background Context of the Pyth Network and IOTA Integration

For several years, decentralized finance (DeFi) ecosystems operating across various layer-1 and layer-2 blockchains have relied heavily on decentralized oracle networks to securely bridge real-world market pricing onto the blockchain. Smart contracts are inherently isolated execution environments; they cannot natively access external data streams such as foreign exchange rates, commodity valuations, or equity prices. To bridge this divide, Pyth Network established itself as a leading provider of high-frequency, cryptographically verified price feeds.

Previously, the integration between Pyth and the IOTA ecosystem operated via Pythnet—Pyth’s original decentralized node network. Pythnet relied on the Wormhole interoperability protocol to relay cross-chain price updates, allowing IOTA smart contracts to query live price points refreshed approximately once every second. While this legacy system successfully enabled foundational decentralized applications to operate with trusted market data, it possessed inherent performance and scalability bottlenecks typical of cross-chain bridging mechanisms.

The introduction of Pyth Pro fundamentally alters this dynamic by establishing a direct, highly optimized distribution channel designed explicitly to meet the rigorous demands of institutional financial firms, high-frequency trading desks, and sophisticated DeFi protocols.

Pyth Pro as the New Institutional Tier

Pyth Pro has been engineered to consolidate over 3,000 price feeds spanning a diverse array of global asset classes—including equities, futures, exchange-traded funds (ETFs), commodities, foreign exchange (FX), cryptocurrencies, and fixed-income products—into a unified distribution network. By delivering these data streams to traditional financial institutions and advanced blockchain environments through standardized application programming interfaces (APIs), Pyth is effectively bridging the gap between traditional finance (TradFi) and decentralized finance (DeFi).

The institutional-grade nature of Pyth Pro centers on several core technological and structural enhancements:

  1. Reduced Latency: By streamlining the data delivery pipeline and optimizing validator reporting mechanisms, Pyth Pro drastically cuts down the time required for price updates to reach on-chain smart contracts. This is critical for perpetual swap platforms, decentralized derivatives exchanges, and automated market makers (AMMs) that require absolute precision to prevent arbitrage exploitation and toxic order flow.

  2. Expanded Asset Coverage: Developers building on IOTA now gain access to a vastly expanded menu of institutional data assets. Beyond standard cryptocurrency pairs, developers can theoretically build novel financial instruments tied to global macro assets, expanding the total addressable market for IOTA-native dApps.

  3. Enhanced Reliability and Cryptographic Verification: Maintaining the core ethos of decentralized oracles, Pyth Pro continues to provide first-party financial data sourced directly from primary market makers, traditional exchanges, and multi-signature institutional contributors. Each price update remains cryptographically signed to ensure tamper resistance and absolute transparency.

Chronology and Migration Timeline

The migration from Pythnet to Pyth Pro represents a network-wide paradigm shift executed by the Pyth contributors, rather than an isolated update initiated exclusively by the IOTA Foundation. As Pyth transitions its entire ecosystem to the new institutional infrastructure, legacy systems are being systematically retired.

Crucially, the sunsetting of legacy infrastructure imposes a strict deadline on developers. Smart contracts and decentralized applications currently interacting with the older Pyth Core and Pythnet feeds must complete their technical migrations by August 18. Failure to update the respective smart contract integrations before this cutoff date will result in price feeds halting entirely, potentially disrupting dependent dApp functionalities such as lending liquidations, margin calculations, and token swaps.

The structural transition also introduces a commercial evolution. While early-stage decentralized oracles often relied entirely on foundational grants and subsidized models, Pyth Pro implements a structured, transparent, and tiered subscription pricing framework. This ensures the long-term economic sustainability of the oracle network by tying data consumption directly to revenue-based economic models, aligning the growth of the oracle infrastructure with the commercial success of the applications consuming its data.

Implications for IOTA Developers and the Layer 1 Ecosystem

The integration of Pyth Pro carries profound implications for developers building on the IOTA Layer 1 network. Historically, IOTA has focused heavily on enterprise adoption, feeless value transfer, and real-world asset (RWA) tokenization. However, the maturation of its smart contract capabilities requires robust, institutional-grade financial infrastructure to support complex decentralized financial applications.

By securing access to Pyth Pro, IOTA developers are now equipped to compete directly with ecosystems traditionally dominating the DeFi landscape, such as Ethereum, Solana, and various Layer 2 scaling networks. Applications requiring high-frequency updates—such as synthetic asset platforms, sophisticated lending markets, and leveraged trading protocols—can now deploy on IOTA with the structural assurance that their underlying data feeds meet the stringent latency and reliability expectations of institutional-grade market participants.

Furthermore, this infrastructure upgrade positions the IOTA network advantageously for the next secular wave of crypto adoption: the convergence of TradFi and decentralized rails. As institutional asset managers increasingly explore tokenized securities, regulatory-compliant funds, and on-chain credit markets, the demand for enterprise-grade oracles that can seamlessly serve both traditional financial APIs and blockchain-native smart contracts will intensify.

Fact-Based Analysis of the Operational Shift

Analyzing the broader market context reveals that oracle infrastructure is undergoing a rapid maturation phase. The shift from free, highly subsidized oracle models to sustainable, enterprise-tier subscription frameworks reflects a broader industry realization: high-frequency, reliable financial data is a premium commodity that requires continuous capital expenditure, secure validator incentives, and enterprise-grade SLA (Service Level Agreement) standards.

For IOTA, adopting Pyth Pro eliminates the technical debt and potential security vulnerabilities associated with legacy cross-chain bridges like Wormhole for price relaying, replacing them with a more direct and resilient architecture. While the immediate operational burden falls on developers to execute code migrations prior to the August 18 deadline, the long-term payoff is a vastly superior execution environment.

The transition underscores a maturing ecosystem where protocols can no longer rely on temporary infrastructural workarounds. Instead, they must align with industry-standard commercial frameworks that guarantee enterprise reliability. As decentralized finance continues to institutionalize, the availability of Pyth Pro on IOTA ensures that developers building on the network are not constrained by second-tier data limitations, thereby opening new avenues for institutional liquidity, advanced financial product development, and sustained ecosystem growth.

September 21, 2026 0 comment
0 FacebookTwitterPinterestEmail
Altcoins & Token Projects

XRP Market Dynamics Shift as Upbit Wallet Activity Surges Toward Crucial Resistance Levels

by Layla Zulfa September 21, 2026
written by Layla Zulfa

The cryptocurrency market is currently witnessing a notable concentration of XRP activity centered on South Korea’s Upbit exchange, a development that has captured the attention of institutional analysts and retail traders alike. As XRP approaches the psychologically significant $1.20 resistance level, recent data from analytics firm CryptoQuant highlights a pronounced shift in net wallet flow dominance. This concentration of volume, particularly on a platform known for its high retail participation, serves as a focal point for market observers attempting to gauge the next leg of price action.

The Anatomy of the Upbit Flow Surge

According to data tracked by CryptoQuant, Upbit’s XRP Net Wallet Flow Dominance underwent a significant expansion over the course of a single week. Starting at 13% on June 7, the dominance figure climbed to 31% by June 14, marking the highest level of concentration since May 2024. This rapid influx indicates that a disproportionate amount of global XRP exchange activity is currently being funneled through the South Korean exchange, effectively displacing the previous distribution of liquidity across global platforms.

In the context of cryptocurrency markets, "Net Wallet Flow Dominance" refers to the share of total exchange inflows and outflows attributed to a specific platform. When one exchange sees such a sharp, sudden increase in dominance, it often suggests that a specific regional cohort—in this case, South Korean investors—is driving market sentiment. South Korea has historically maintained a unique relationship with XRP, with the asset frequently trading at a premium on local exchanges due to high retail demand and the country’s robust digital asset infrastructure.

Chronology of Recent Market Activity

The current setup follows a period of consolidation for XRP, which has struggled to sustain momentum above the $1.20 threshold for several months. Throughout early June, XRP prices remained within a tight range, reflecting a broader stagnation in the altcoin sector as Bitcoin navigated its own regulatory and macroeconomic challenges.

The surge in Upbit activity coincides with a period of increased volatility in the broader digital asset market. As the market entered mid-June, traders began repositioning their portfolios, anticipating a potential breakout for assets that had lagged behind during previous cycles. The uptick in wallet flow began on June 7, signaling the start of a trend that saw market participants moving assets onto the exchange, presumably to facilitate faster execution or to capitalize on anticipated price movements. By June 14, the concentration had reached a local peak, aligning with a renewed push toward the $1.20 resistance level.

Understanding the $1.20 Resistance Barrier

For market technicians, the $1.20 level represents more than just a price point; it is a structural barrier that has defined the upper bounds of XRP’s recent trading range. Resistance levels are formed where selling pressure historically overwhelms buying pressure, causing a pullback. When an asset approaches such a level, the market typically enters a phase of "price discovery," where traders look for signals—such as volume spikes or shifts in exchange flow—to determine if the asset has the momentum to break through.

A clean break above $1.20 would require significant buying pressure to absorb existing sell orders. Analysts emphasize that a "wick" above the level, followed by a quick retreat, would be considered a failed breakout or a "liquidity sweep." In this scenario, market makers often push price into a zone of high order density to trigger stop-loss orders or entice traders to buy, only to reverse the trend. Conversely, a sustained close above $1.20, supported by the high exchange activity currently observed on Upbit, would provide the necessary confirmation for a potential trend reversal.

XRP Eyes $1.20 Breakout As Upbit Flows Hit Highest Share Since May 2024

Interpretation of Exchange Flow Data

While the surge in Upbit activity is a compelling data point, market analysts urge caution regarding the interpretation of wallet flows. It is a common misconception that all exchange inflows are indicative of immediate selling pressure. While high inflows can suggest that traders are preparing to sell their holdings, they can also represent:

  1. Market Maker Positioning: Liquidity providers often move assets between wallets and exchanges to maintain tight spreads and facilitate trading.
  2. Institutional Rebalancing: Larger entities may be moving funds to prepare for automated trading strategies or internal ledger reconciliations.
  3. Regional Arbitrage: Traders may be moving XRP to Upbit to capitalize on the "Kimchi Premium," the price disparity that often exists between South Korean exchanges and international markets.

Therefore, while the 31% dominance figure is a strong indicator of regional interest, it must be viewed as part of a larger, multifaceted market puzzle. It provides the "context" for the current price movement, confirming that the current volatility is not happening in a vacuum but is supported by actual movement of capital within the ecosystem.

The Role of Broader Market Conditions

The performance of XRP cannot be decoupled from the performance of Bitcoin. Historically, XRP has shown a high correlation with the broader altcoin market, which in turn follows the general direction of Bitcoin. For a breakout above $1.20 to be successful, it is generally required that Bitcoin remains stable or experiences upward momentum. If Bitcoin experiences a sharp correction, the liquidity required to sustain an XRP breakout may evaporate, regardless of the activity level on specific exchanges like Upbit.

Moreover, the current regulatory climate surrounding digital assets continues to play a role in market sentiment. While the specific legal challenges faced by XRP’s primary stakeholders have seen significant resolution, the ongoing institutional scrutiny of the crypto sector as a whole means that any price movement is subject to rapid reversals based on macro-regulatory updates or shifts in global monetary policy.

Strategic Implications for Traders and Investors

For those monitoring the current market, the focus remains on the interplay between the $1.20 resistance and the sustained activity on Upbit. If the high flow dominance persists as the price approaches this level, it suggests a "high-conviction" environment. In technical analysis, conviction is the difference between a fleeting price spike and a sustainable trend shift.

Institutional analysts suggest that the coming week will be critical. If XRP can secure a daily close above $1.20 with accompanying volume expansion, it would validate the theory that the recent surge in activity was driven by genuine accumulation rather than short-term speculative positioning. Conversely, should the price fail to hold this level, the concentration of assets on Upbit could paradoxically turn into a headwind, as those who moved funds onto the exchange in anticipation of a breakout may decide to exit if their expectations are not met.

Conclusion: A Critical Juncture

The current state of the XRP market is characterized by a rare alignment of technical resistance and on-chain flow activity. The surge in Upbit wallet dominance to 31% acts as a spotlight on South Korean market sentiment, providing a clear indicator of where the current momentum is originating. However, the path forward remains dependent on broader market stability and the ability of bulls to convert technical interest into concrete, sustained price action above the $1.20 threshold.

As with all high-volatility assets, the current situation underscores the importance of monitoring multi-dimensional data. By balancing technical price analysis with on-chain flow metrics, market participants can better understand the forces at play, moving beyond simple price movements to appreciate the structural shifts occurring within the global XRP marketplace. The coming days will likely determine whether this shift in flow dominance marks the beginning of a sustained upward move or simply another cycle of resistance testing within the current trading range.

September 21, 2026 0 comment
0 FacebookTwitterPinterestEmail
Newer Posts
Older Posts

Recent Posts

  • Bitcoin Smashes Through $85,000 Milestone to Reach Highest Price Level in Eight Months
  • Bitcoin Enters Historical Dollar-Cost Averaging Zone as Market Sentiment Shifts to Fear and Accumulation
  • Ethereum Protocol Roadmap 2026-2029: Securing the Future of Decentralized Finance
  • Ethereum Price Surge Above $2,631 Support Sparks Optimism as Bulls Target $3,520 Amid Strong Q3 Performance
  • Ethereum Faces Bearish Price Pressure While On-Chain Activity and Institutional Accumulation Reach Historic Highs

Recent Comments

No comments to show.
  • Facebook
  • Twitter

@2021 - All Right Reserved. Designed and Developed by PenciDesign


Back To Top
Crypto Gohan
  • Home

We are using cookies to give you the best experience on our website.

You can find out more about which cookies we are using or switch them off in .

Crypto Gohan
Powered by  GDPR Cookie Compliance
Privacy Overview

This website uses cookies so that we can provide you with the best user experience possible. Cookie information is stored in your browser and performs functions such as recognising you when you return to our website and helping our team to understand which sections of the website you find most interesting and useful.

Strictly Necessary Cookies

Strictly Necessary Cookie should be enabled at all times so that we can save your preferences for cookie settings.