In the high-stakes environment of organ transplantation, every fraction of a second carries profound weight. When a donor heart becomes available, a tightly compressed operational countdown begins immediately. Human organs possess a strictly limited window of viability outside the human body—often spanning only a few hours. Within this narrow timeframe, a complex choreography must unfold across multiple locations. Dozens of medical professionals, provincial coordinators, institutional administrators, and national regulators are required to act in synchronized sequence. Every medical record, authorization, and legal consent must be fundamentally accurate and completely undisputed upon first review. In this delicate ecosystem, a misplaced document, a disputed signature, or an unverifiable record can result in the catastrophic loss of a human life.
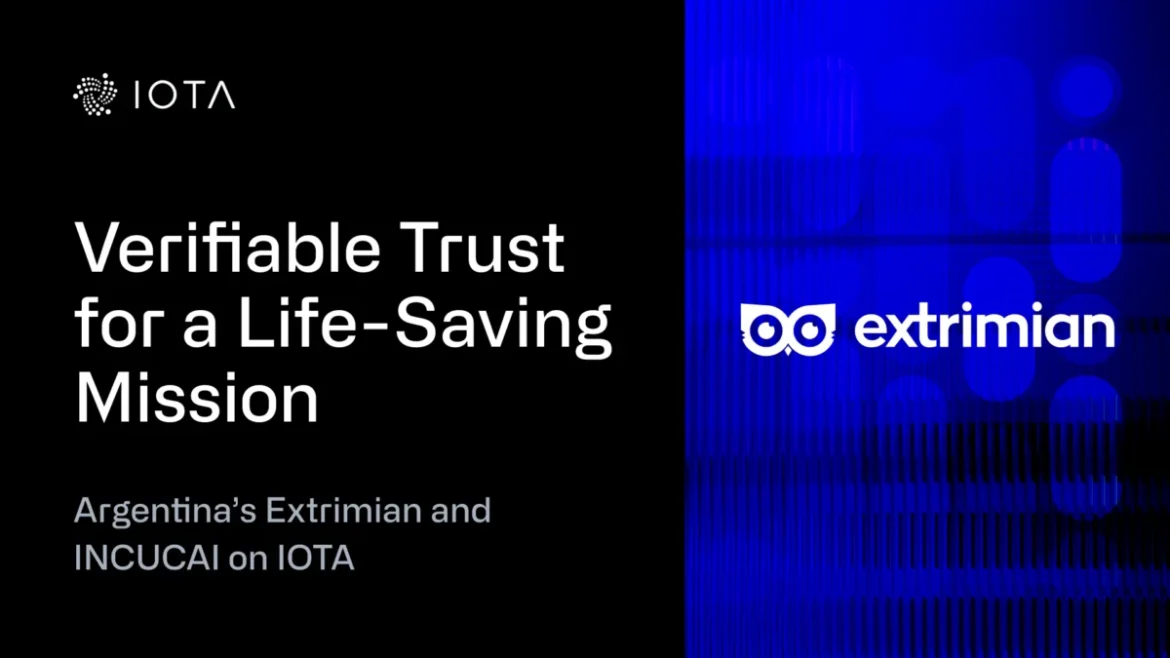
To mitigate these systemic risks and safeguard the integrity of its life-saving pipeline, Argentina has undertaken a monumental digital transformation. The nation’s central authority for organ, tissue, and cell procurement and transplantation—the Instituto Nacional Central Único Coordinador de Ablación e Implante (INCUCAI)—has officially integrated its national infrastructure onto a live, publicly verifiable decentralized identity system. Developed in strategic collaboration with Latin American digital identity pioneer Extrimian and anchored securely to the IOTA mainnet, this deployment establishes a new benchmark for how public institutions can leverage distributed ledger technology to protect human life without compromising individual privacy.
The Structural Architecture of Argentina’s Transplant Network
At the heart of Argentina’s donation framework is INCUCAI, a state entity tasked with managing the national waiting list, establishing regulatory protocols, and overseeing the entire lifecycle of organ and tissue procurement. However, national coordination is only as strong as its regional nodes. INCUCAI operates in constant tandem with 24 distinct jurisdictional procurement agencies—encompassing every Argentine province alongside the Autonomous City of Buenos Aires—as well as a vast network of public and private hospitals, surgical suites, and specialized transplant clinics.
Coordinating life-or-death decisions across this sprawling national footprint has historically presented logistical vulnerabilities. Managing physical paperwork, disparate provincial databases, and manual verification steps introduced friction and potential delays into a process where absolute efficiency is mandatory. Recognizing the urgent need for modernization, INCUCAI sought a technological partner capable of delivering absolute institutional transparency, immutable record-keeping, and high-speed interoperability.
Enter Extrimian, a specialized Latin American technology firm recognized for its expertise in self-sovereign identity (SSI) frameworks. SSI empowers individuals and institutions by granting them direct, cryptographic control over their digital identities and the specific data they choose to disclose. Extrimian’s overarching mission focuses on driving efficiency, security, and institutional transparency across heavily regulated sectors, including healthcare, public administration, and education. To support INCUCAI’s massive operational scale, Extrimian required a robust, scalable, and environmentally sustainable public ledger. They selected IOTA, a neutral, verifiable decentralized layer capable of authenticating institutional identities and validating document integrity without reliance on centralized gatekeepers or proprietary intermediaries.
Decentralization Meets Strict Data Privacy
A primary concern in deploying blockchain-based solutions within healthcare environments is the protection of sensitive medical data. Privacy regulations, medical ethics, and basic human dignity demand that a patient’s private health information remains strictly confidential. The architecture deployed by Extrimian and INCUCAI addresses this concern through cryptographic minimalism.
Under the newly implemented system, no patient-identifiable information or raw medical records are ever stored on the public blockchain. Instead, the architecture relies exclusively on cryptographic hashes—mathematical fingerprints—of official documents and procedural steps. These hashes are anchored directly to the IOTA ledger, creating an immutable, timestamped proof of existence and integrity.
This separation ensures that while doctors, regulatory agencies, and legal auditors can mathematically confirm that every procedural step occurred exactly as recorded, the underlying personal and medical details remain fully protected. Grieving families and vulnerable patients can entrust their most critical moments to the system with the absolute assurance that their privacy is uncompromised, even as systemic accountability is rigorously enforced.
Chronology of Implementation: From Conceptualization to Resolution 199/2026
The integration of Argentina’s transplant system onto the blockchain is the culmination of meticulous planning, technical testing, and regulatory alignment.
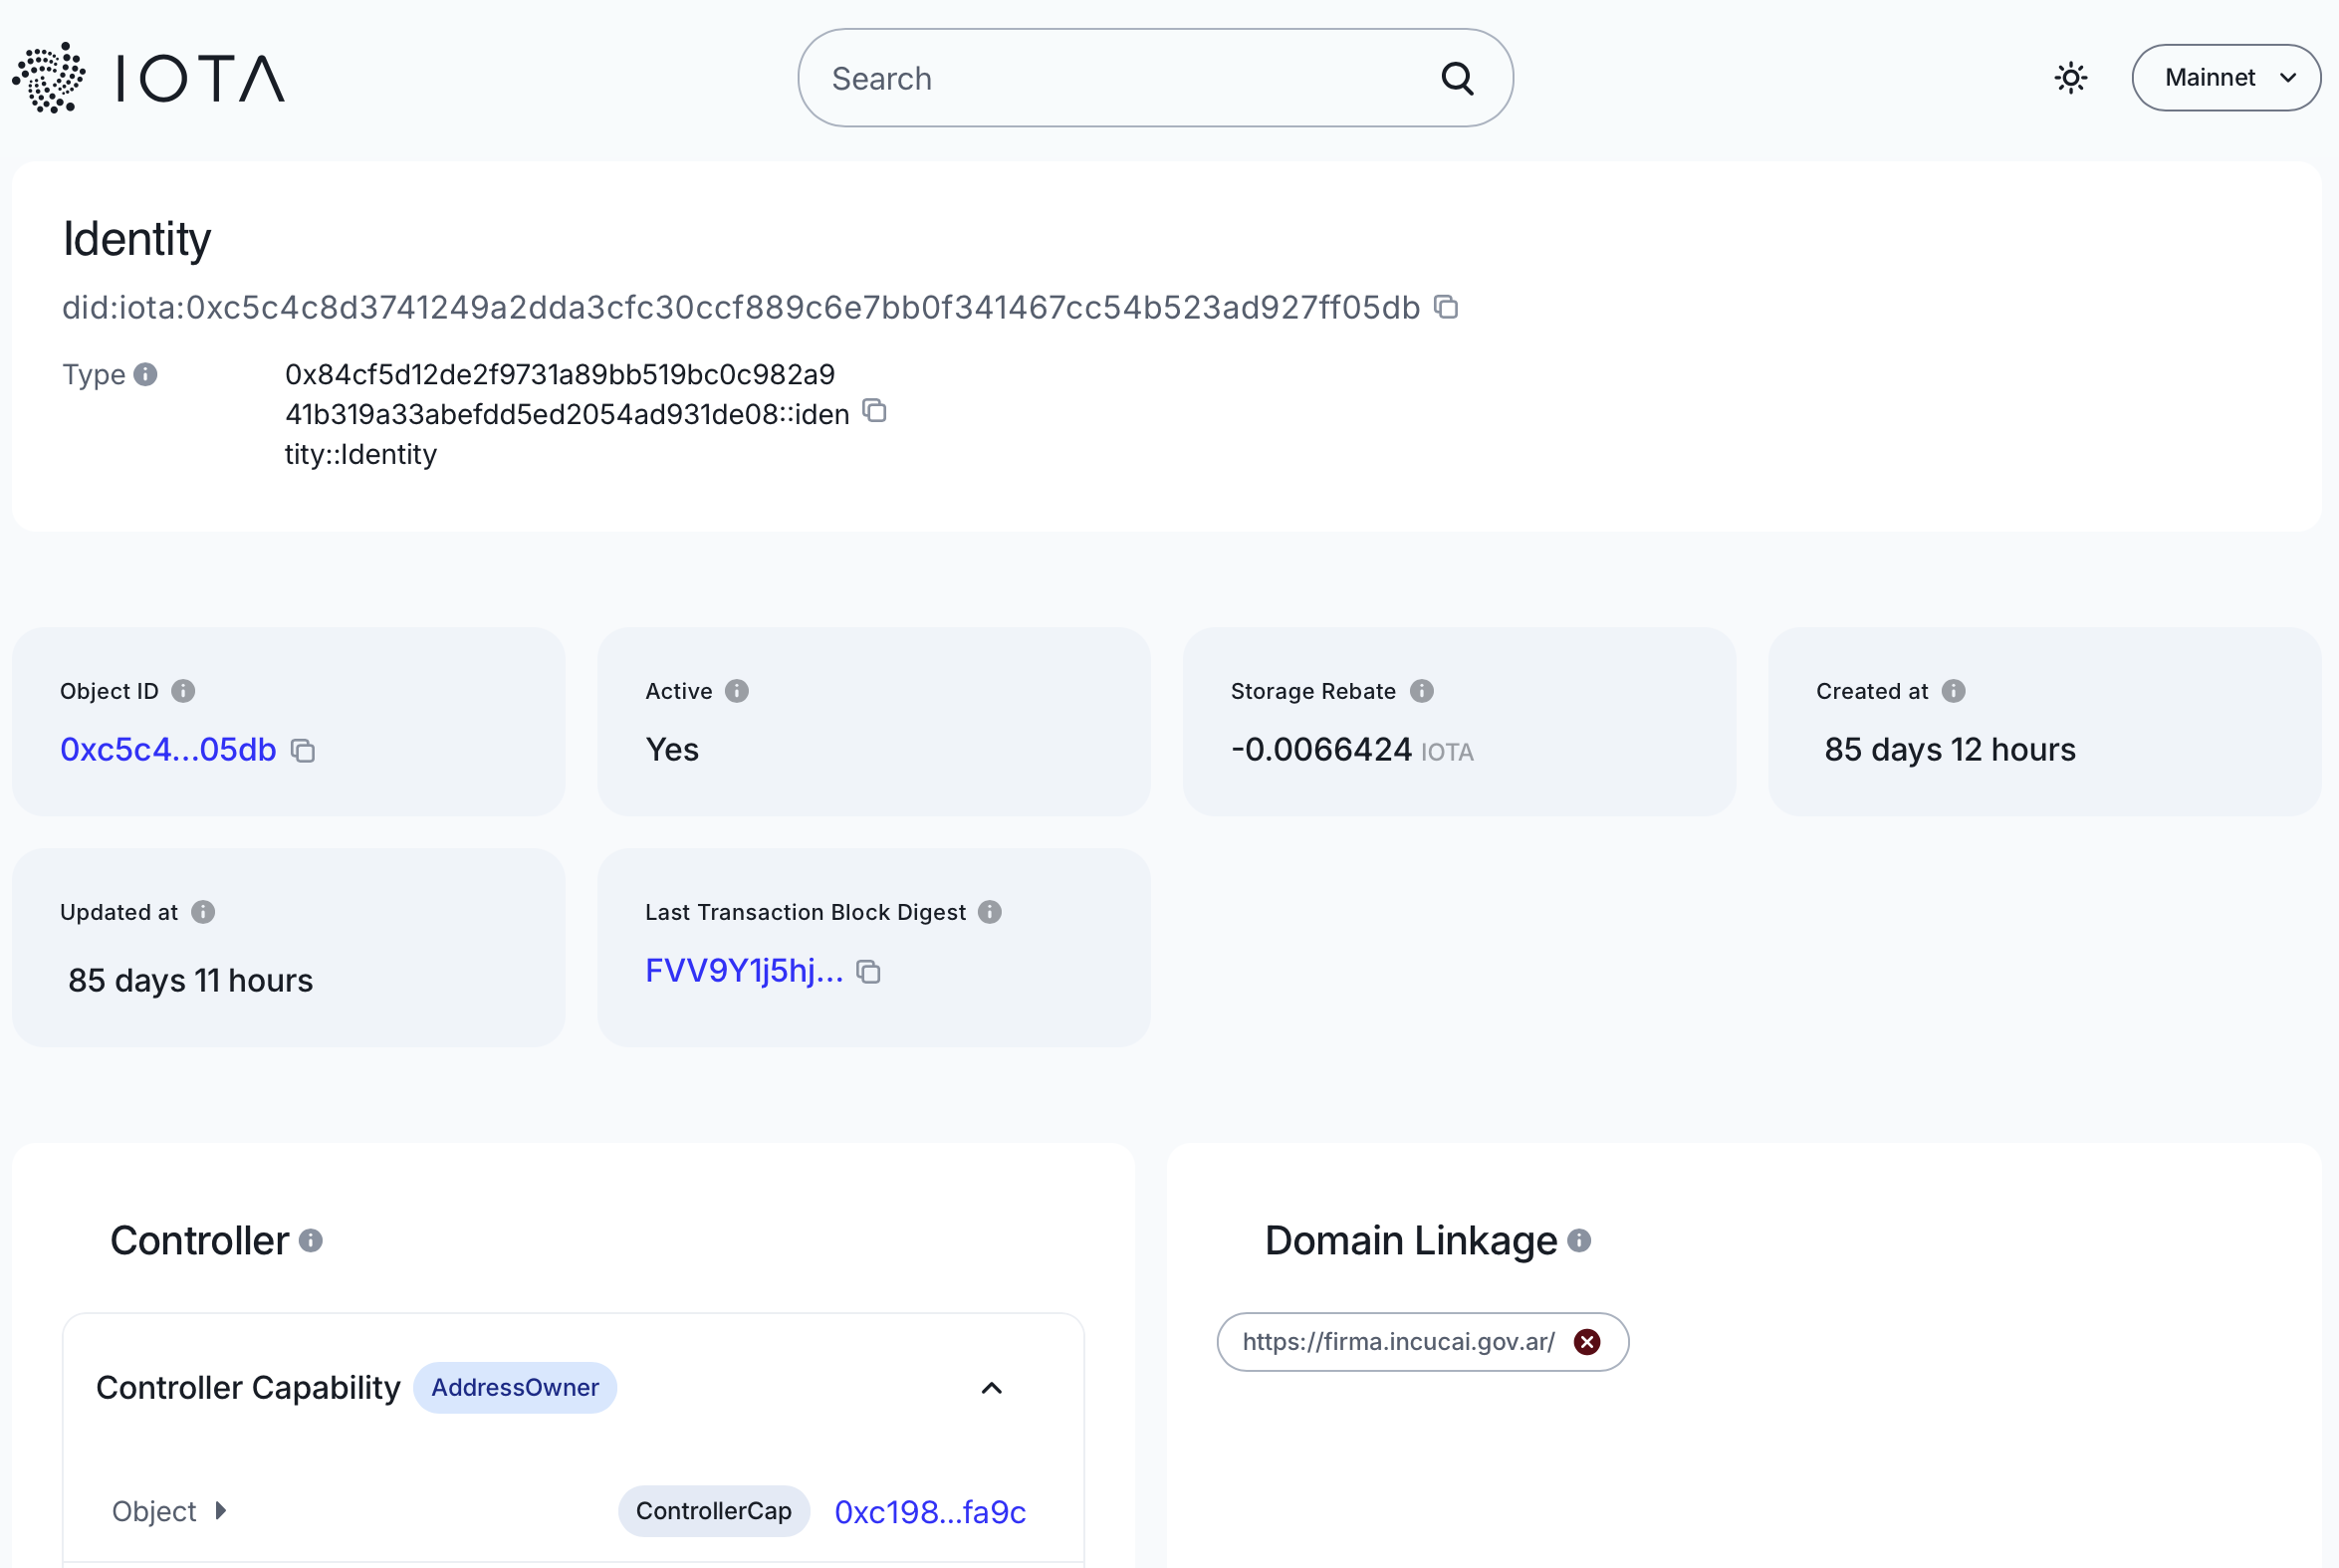
The groundwork for the project involved rigorous development phases to align W3C-compliant decentralized identifiers (DIDs) with institutional sign-offs. A critical milestone was reached when INCUCAI’s official institutional identity was formally anchored to the IOTA mainnet, featuring cryptographic domain linkage to its official government signing platform. This linkage ensures that any external observer can independently verify that the digital entity controlling the credentials belongs to the authentic national authority rather than an impostor. Furthermore, portions of the critical infrastructure were integrated with ARSAT, Argentina’s state-owned telecommunications and digital infrastructure company, ensuring that foundational components remain firmly under sovereign national control.
The formal transition into operational adoption arrived in June 2026. Through Resolution 199/2026, published officially in the national Boletín Oficial, INCUCAI mandated the implementation of advanced electronic signatures across every operational process managed through SINTRA—Argentina’s National Procurement and Transplant Information System—and its connected institutional workflows. This regulatory mandate provided the legal framework necessary to transition certification, authorization, and validation processes into a blockchain-backed operational reality.
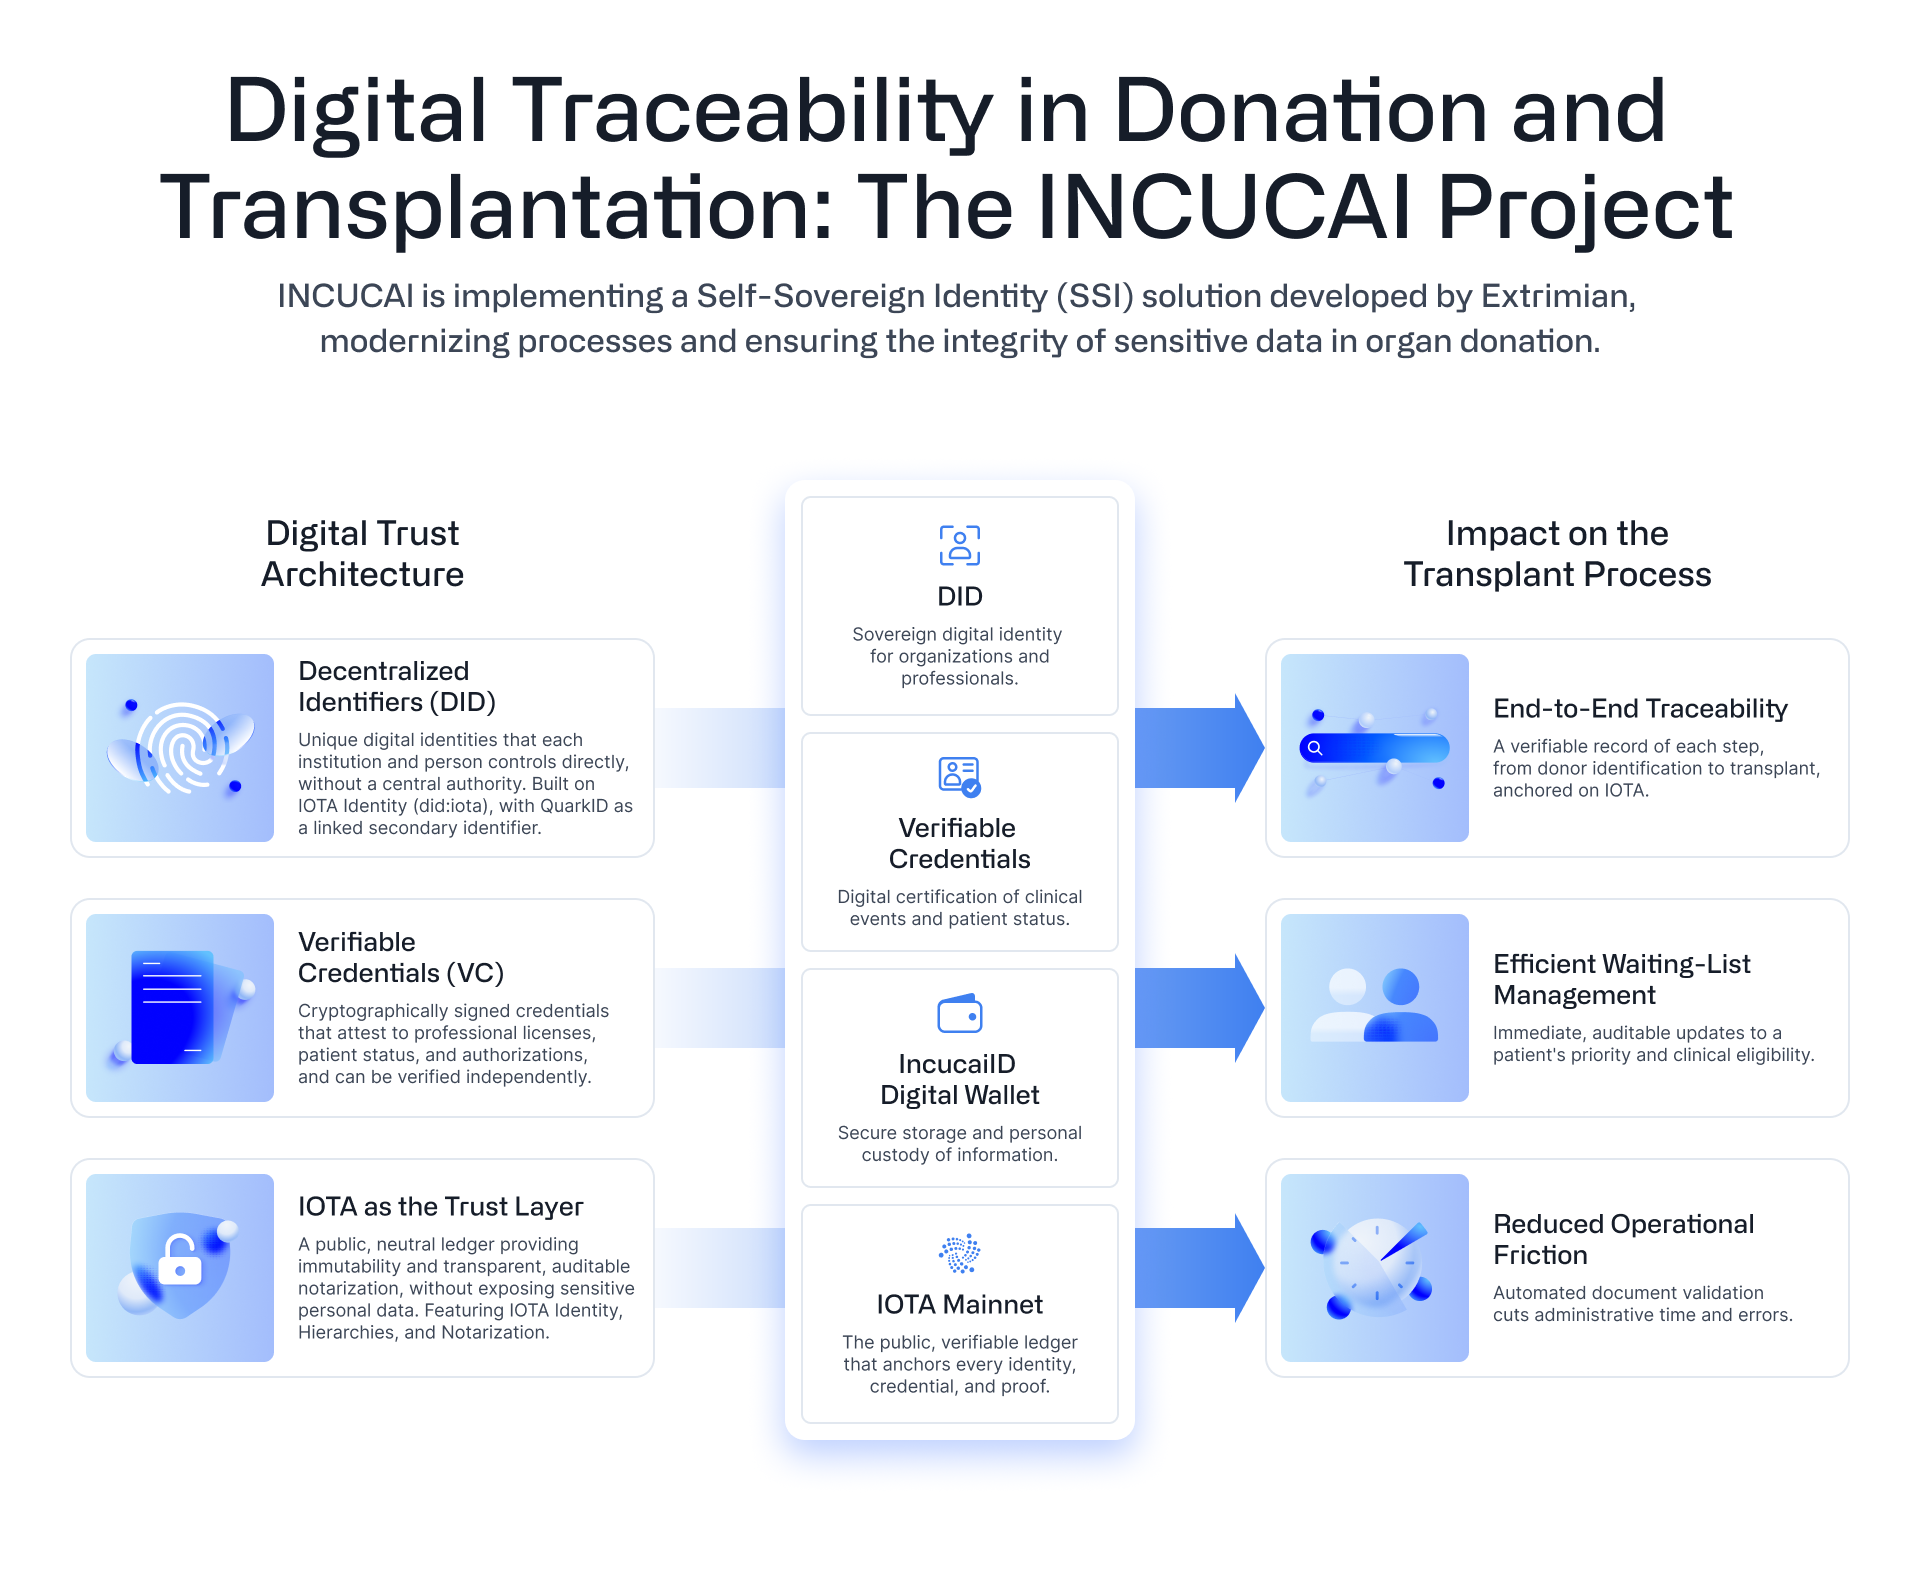
As of June 10, 2026, the foundational identity and notarization layers went fully live on the public IOTA Mainnet. Following this deployment, INCUCAI introduced IncucaiID, the ecosystem’s dedicated mobile application wallet available for download across major app stores. Through this application, authorized healthcare professionals, administrative personnel, and patients receive verifiable credentials, authenticate their identities, and apply legally binding electronic signatures to transplant-related documentation.
The phased rollout begins specifically with the registration processes for heart and lung transplant waiting lists. Over subsequent phases, the system is scheduled to expand to encompass all remaining organ and tissue lists, eventually absorbing the entirety of SINTRA’s documentary and procedural workflows to establish a fully paperless, frictionless national environment.
Independent Verification and Technological Integrity
In adherence to the core cryptographic philosophy of "don’t trust, verify," the technological integrity of the INCUCAI-Extrimian deployment has been subjected to independent audit. External observers, including technical teams from the IOTA Foundation, conducted independent reviews operating solely from public endpoints and the IOTA Explorer.
The audit confirmed that all 24 provincial agency identities successfully resolved on-chain, all public explorer verification links matched institutional data, and direct ledger queries verified that the entities controlling each decentralized identifier were precisely those accredited within the national trust federation. This level of verifiable transparency ensures that the system is entirely resistant to internal tampering, unauthorized credential alteration, or external interference.
Official Perspectives and Institutional Leadership
The convergence of advanced distributed ledger technology with public healthcare administration has drawn praise from key leaders guiding the initiative.
Daniela Hansen Krogh, Director of Information Technology and Information Systems at INCUCAI, emphasized the foundational role of trust in organ donation. "Trust is at the heart of every organ donation and transplantation process," Hansen Krogh stated. "Our responsibility is to ensure that every decision is supported by reliable, secure, and verifiable information. By incorporating decentralized identity and cryptographic verification into our national systems, we are strengthening the integrity, traceability, and legal certainty of every critical stage, while safeguarding sensitive patient information. This initiative reflects INCUCAI’s ongoing commitment to modernizing Argentina’s transplant system through secure, transparent, and citizen-centered digital innovation."
Echoing these sentiments, Esteban Musso, Professional Services Manager and Partner at Extrimian, highlighted the broader paradigm shift represented by the project. "At Extrimian, we believe that trust is the foundation of every digital transformation," Musso noted. "By combining open standards with privacy-preserving technologies, we’ve helped build a solution that enhances traceability, security, and interoperability while respecting the privacy of every participant. Projects like this demonstrate that decentralized technologies are no longer a vision for the future—they are delivering tangible value today in critical public services."
Dominik Schiener, Co-Founder and Chairman of the IOTA Foundation, underscored the immense societal value of deploying distributed ledger technology at a national scale. "This is what IOTA’s open technology can do for critical public services at national scale: real infrastructure, already coordinating decisions that save lives," Schiener remarked.
Implications and Broader Impact on Public Sector Digital Infrastructure
The successful migration of Argentina’s organ transplant verification framework onto a public ledger establishes a transformative precedent for public administration worldwide. Historically, government agencies have struggled to balance the demands of absolute transparency with the legal imperative of data privacy, frequently defaulting to siloed, opaque, and vulnerable centralized databases.
By deploying an open standards-based, self-sovereign identity architecture anchored to a neutral public layer, INCUCAI and Extrimian have demonstrated that modern cryptographic tools can optimize high-stakes state logistics without sacrificing citizen privacy or national technological sovereignty. As the implementation scales to cover all provincial agencies and transplant waiting lists across Argentina, the model offers a replicable blueprint for public health authorities globally, proving that decentralized technology can effectively transition from theoretical discourse into life-saving, everyday institutional practice.