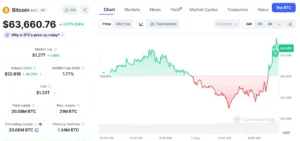
A Bitcoin roadmap published in February by the crypto commentator known as Klarck on X (formerly Twitter) has resurfaced as current market dynamics have brought Bitcoin’s price into close proximity with one of the key downside zones outlined months earlier. This renewed focus on an older forecast underscores the cyclical nature of market analysis and the potential for long-term technical projections to gain significant relevance as price action unfolds.
Revisiting a February Forecast: Klarck’s Bitcoin Roadmap
In early February, amid a burgeoning bullish sentiment that saw Bitcoin steadily climbing, Klarck presented a comprehensive price roadmap. This projection detailed a multi-stage trajectory for Bitcoin, beginning with an anticipated bounce towards the $83,000 mark. Following this initial ascent, the roadmap then predicted a gradual but significant decline into a critical accumulation region, specifically identified as the $65,000 to $55,000 range. According to Klarck’s analysis, Bitcoin would then undergo a two-week accumulation phase within this zone before transitioning back into a growth trajectory, ultimately targeting an ambitious $140,000 per BTC. The original post, while not current market commentary, has regained traction precisely because Bitcoin’s recent price movements have brought it to the doorstep of the previously identified downside range, prompting a fresh examination of its predictive accuracy. It is crucial to note that while the market is validating a segment of this older prediction, it does not inherently guarantee the accuracy of the entire forecast, particularly the more distant upside target. However, it serves as a compelling illustration of how seasoned traders and analysts often revisit historical technical maps when price action begins to converge with their outlined paths.
The Original Projection: A Detailed Breakdown
Klarck’s February roadmap was not merely a single price target but a sequential narrative of market phases. The initial call for a bounce towards $83,000 suggested a continuation of the upward momentum observed in early 2024, likely fueled by anticipation surrounding the Bitcoin halving event and the approval of spot Bitcoin Exchange-Traded Funds (ETFs) in the United States. This phase represented a continuation of the rally that had lifted Bitcoin from its 2023 lows.
The subsequent prediction of a gradual decline into the $65,000-$55,000 region was arguably the most critical and, at the time, potentially contrarian aspect of the forecast. When Bitcoin was trading significantly below these levels in February, a call for a future decline into this range might have seemed extreme or improbable to many market participants. However, the roadmap specifically identified this area as a crucial "accumulation phase," implying a period where smart money or institutional players would likely be acquiring Bitcoin, building positions for the next leg up. The projected two-week duration for this accumulation suggested a relatively swift consolidation before a renewed upward push. The ultimate target of $140,000 per BTC represented a highly bullish long-term outlook, positioning Bitcoin well beyond its previous all-time highs. This ambitious target likely factored in historical post-halving cycles and the potential for increased institutional adoption.
Bitcoin’s Journey Since February: Validating Early Stages
Following Klarck’s February post, Bitcoin indeed experienced a robust rally. The cryptocurrency surged past its previous all-time high of approximately $69,000, eventually reaching a peak near $73,750 in March. While it did not precisely hit the $83,000 mark projected by Klarck, this initial upward movement broadly aligned with the bullish sentiment embedded in the early stages of the roadmap. The rally was largely driven by sustained inflows into the newly launched spot Bitcoin ETFs, which absorbed significant supply, coupled with increasing optimism ahead of the April halving event.
However, after peaking in March, Bitcoin entered a period of consolidation and subsequent correction. From its highs, Bitcoin gradually began to retrace, facing resistance and failing to establish new higher highs. This correctional phase has now brought the price of Bitcoin into the upper echelons of Klarck’s identified downside range. As of recent market action, Bitcoin has been trading around the $65,000 to $60,000 levels, testing the very boundary of the accumulation zone described in the February roadmap. This convergence of current price action with a specific, previously forecasted range is precisely what has brought Klarck’s analysis back into the spotlight. It offers a tangible example of how long-term technical projections can materialize, albeit not always with perfect precision in timing or exact price points, but often with remarkable accuracy concerning critical support and resistance zones.

The Critical $65,000-$55,000 Accumulation Zone
The $65,000-$55,000 zone is now the focal point for many market observers, aligning with Klarck’s roadmap. This range is not merely an arbitrary set of numbers; it often carries significant technical and psychological weight in financial markets.
- Technical Significance and Historical Precedent: From a technical analysis standpoint, this region often represents a confluence of important levels. For instance, it encompasses the previous all-time high from late 2021, which, once breached, often acts as strong support on subsequent pullbacks. Additionally, Fibonacci retracement levels from the recent bullish impulse might converge within this range, providing further technical validation. High-volume nodes on volume profile charts could also indicate significant historical trading activity and potential liquidity pools in this area, suggesting that many participants are either willing to buy or sell at these prices. If this zone holds, it would signify a healthy market correction, allowing for profit-taking and the entry of new capital before a potential continuation of the uptrend.
- Understanding the Accumulation Phase: Klarck’s roadmap describes this as an "accumulation phase." In technical terms, an accumulation phase typically involves a period of consolidation where price movement becomes constrained within a tighter range, often characterized by decreasing volatility. During this phase, selling pressure tends to diminish, and buyers gradually absorb available supply without driving the price significantly higher. Volume analysis often shows higher volume on down moves initially, followed by increasing volume on upward moves within the range, indicating buyers stepping in. The "two-week" duration suggested by Klarck is a specific timeframe that, if observed, would point to a relatively quick turnaround in market sentiment following the correction.
- Potential Scenarios: Hold vs. Break: The market’s reaction to this zone will be crucial. If Bitcoin successfully stabilizes within the $65,000-$55,000 range, establishing a clear base and demonstrating signs of diminishing selling pressure (e.g., lower lows stopping, tighter range formation, increasing buying volume on dips), it would lend significant credence to the "accumulation phase" aspect of Klarck’s roadmap. Such stabilization would suggest that sellers are losing control and that demand is sufficient to prevent further downside. Conversely, a failure to hold the upper end of this zone, particularly the $65,000 level, could trigger further downside momentum. Traders would then likely shift their focus to the lower boundary near $55,000 as the next potential liquidity target. A decisive break below $55,000 would invalidate this specific accumulation scenario and could signal a deeper correction, potentially towards lower support levels, fundamentally altering the short-to-medium-term outlook.
Broader Market Context and Supporting Data
To fully appreciate the significance of Klarck’s roadmap, it is essential to contextualize it within the broader market landscape and integrate supporting data from various analytical domains.
- On-Chain Indicators: Whale Movements and Supply Dynamics: On-chain metrics provide invaluable insights into the behavior of market participants. For instance, monitoring whale addresses (large holders) for accumulation or distribution patterns within the $65,000-$55,000 zone could either confirm or contradict the idea of an accumulation phase. Metrics like the MVRV (Market Value to Realized Value) ratio, which compares market capitalization to the sum of prices at which each coin last moved, can indicate whether the market is overvalued or undervalued relative to its cost basis. If the MVRV approaches historical support levels within this price range, it could signal a strong buying opportunity. Similarly, tracking exchange net position changes – whether more Bitcoin is flowing onto or off exchanges – can reveal aggregate buying or selling pressure, with net outflows often preceding price increases as supply diminishes.
- Derivatives Market: Sentiment and Liquidation Levels: The derivatives market, particularly futures and options, offers a glimpse into traders’ expectations and leverage positions. Funding rates, which are periodic payments exchanged between long and short positions, can indicate prevailing market sentiment. Sustained negative funding rates in a downtrend might suggest an overly bearish market ripe for a short squeeze, while positive rates could imply overheated bullishness. Open interest, the total number of outstanding derivative contracts, coupled with liquidation heatmaps, can pinpoint price levels where significant leveraged positions would be forced to close, potentially exacerbating price movements if these levels are hit within Klarck’s predicted range.
- Macroeconomic Headwinds and Tailwinds: Bitcoin’s price action is not isolated from global macroeconomic forces. Factors such as inflation data, central bank interest rate policies (e.g., the Federal Reserve’s stance on rate cuts), and geopolitical events can significantly influence risk appetite across financial markets, including cryptocurrencies. A more hawkish stance from central banks or unexpected inflationary pressures could dampen enthusiasm for risk assets like Bitcoin, potentially prolonging any accumulation phase or pushing prices below expected support. Conversely, signs of easing monetary policy or a weakening dollar could provide tailwinds for Bitcoin, aiding a recovery from the identified downside zone.
- The Post-Halving Landscape: The Bitcoin halving event in April 2024 reduced the supply of new Bitcoin entering the market by 50%. Historically, halvings have been followed by significant bull runs, albeit with a lag. Klarck’s long-term target of $140,000 per BTC implicitly factors in this historical pattern. The current correction, if it indeed represents an accumulation phase, could be viewed as a necessary consolidation following the halving hype, preparing the ground for the post-halving rally that many analysts anticipate. Understanding the typical post-halving market structure – often characterized by initial volatility followed by a prolonged uptrend – adds another layer of context to Klarck’s multi-stage projection.
Expert Perspectives and Market Sentiment
The re-emergence of Klarck’s February roadmap highlights broader discussions within the crypto analytical community regarding the utility and limitations of technical forecasts.
- The Value of Historical Roadmaps: Many experienced analysts recognize the value in revisiting older, well-articulated technical roadmaps. When a forecast accurately identifies a significant price zone that the market subsequently approaches, it can serve as a powerful validation of the underlying analytical framework. It provides a reference point, a pre-defined set of expectations against which current price action can be measured. This practice is distinct from relying solely on current, often emotionally driven, market commentary. It encourages a more disciplined approach to analysis, focusing on structural patterns and long-term trends rather than short-term noise.
- The Dangers of Confirmation Bias: However, there is a clear danger in attributing excessive weight to old predictions. Markets are dynamic, influenced by an ever-changing confluence of factors, including shifts in macroeconomic conditions, regulatory developments, and unforeseen liquidity events. A forecast, no matter how insightful at the time of its creation, can quickly become outdated. The human tendency towards confirmation bias – where individuals seek out and interpret information in a way that confirms their existing beliefs – poses a significant risk. Traders might selectively focus on the parts of Klarck’s roadmap that are currently playing out while ignoring potential divergences or new market information that could invalidate subsequent stages. This underscores the critical importance of continuously evaluating forecasts against fresh data and current market realities. As many analysts would caution, a roadmap is a guide, not a guaranteed script.
Implications for Traders and Investors: Navigating Volatility
For both seasoned traders and new investors, the current situation presents important lessons and implications for navigating the highly volatile cryptocurrency market.
- The Role of Technical Analysis in Dynamic Markets: Klarck’s roadmap serves as a testament to the enduring, albeit imperfect, utility of technical analysis. By identifying critical support and resistance levels, potential accumulation zones, and projected trajectories, technical analysis provides a framework for understanding market structure and anticipating future movements. However, it also emphasizes that technical forecasts are probabilistic, not deterministic. They offer a high-probability scenario based on historical patterns and current market structure, but they do not account for black swan events or sudden, unpredictable shifts in market fundamentals. Therefore, technical analysis should be used as one tool in a comprehensive analytical toolkit, combined with fundamental analysis, on-chain data, and macroeconomic considerations.
- Prudent Risk Management Strategies: The re-evaluation of an older roadmap, particularly one that includes a significant downside zone, reinforces the necessity of robust risk management. Relying solely on a single forecast, however compelling, is inherently risky. Investors should always diversify their portfolios, never commit more capital than they can afford to lose, and implement clear stop-loss strategies to limit potential downside. For those looking to "accumulate" within the $65,000-$55,000 zone, a dollar-cost averaging strategy might be prudent, spreading purchases over time to mitigate the risk of buying at a local peak within the consolidation range. Furthermore, understanding liquidity targets is crucial; knowing where significant buying or selling pressure might materialize allows traders to anticipate potential price reactions and manage their positions accordingly. The current market juncture demands vigilance, adaptability, and a disciplined approach to capital preservation.
Conclusion: A Crossroads for Bitcoin’s Trajectory
Klarck’s Bitcoin roadmap from February has undeniably re-entered the market conversation, driven by Bitcoin’s recent price action aligning with the crucial $65,000-$55,000 downside accumulation zone. This convergence highlights the enduring relevance of well-articulated technical forecasts, offering a valuable reference point for market participants. The coming weeks will be critical as Bitcoin tests the resilience of this predicted accumulation range. A successful consolidation within this zone could validate the roadmap’s subsequent stages, potentially paving the way for a renewed upward trajectory towards higher targets. Conversely, a failure to hold this key support could signal a deeper correction, necessitating a re-evaluation of market expectations. While the re-ignition of interest in Klarck’s analysis offers a compelling narrative, it is paramount for traders and investors to exercise caution, integrate current market data, and employ robust risk management strategies. The ultimate validity of the entire prediction, particularly the ambitious $140,000 target, remains an open question, contingent on how Bitcoin navigates this pivotal crossroads.