An older Bitcoin roadmap, originally posted in February by crypto commentator Klarck, has recently garnered renewed attention within the digital asset community as the market’s current trajectory closely approaches one of the key downside zones highlighted months prior. This re-evaluation of a past projection underscores the cyclical nature of market analysis and the human tendency to seek patterns, even in highly volatile environments like that of cryptocurrency. The original forecast outlined a path for Bitcoin, beginning with a notable bounce, followed by a gradual decline into a critical support range, an accumulation phase, and ultimately, a significant surge to new all-time highs.
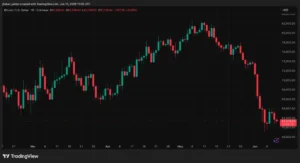
Klarck’s initial projection, shared on X (formerly Twitter) in February, detailed a multi-stage trajectory for Bitcoin (BTC). The roadmap anticipated an initial rally towards the $83,000 mark, succeeded by a measured descent into a critical support region spanning $65,000 to $55,000. Following this anticipated decline, the forecast posited a two-week period of accumulation, where price movements would stabilize and buyers would gradually absorb selling pressure, before a subsequent resurgence driving BTC towards a projected peak of $140,000. This multi-phase outlook captured the imagination of many at the time, offering a structured, albeit speculative, view of Bitcoin’s mid-to-long-term prospects.
It is crucial to emphasize that this renewed interest is not predicated on fresh market commentary or a revised analysis from Klarck. Instead, its relevance stems from the striking alignment of Bitcoin’s recent price action with the initial phases of the roadmap, particularly its approach to the upper threshold of the stipulated downside range. This phenomenon serves as a compelling case study for how market participants and analysts often revisit historical technical roadmaps and cycle predictions when current price movements begin to validate earlier parts of the projected path. Such validation, however, does not inherently guarantee the accuracy of subsequent phases or the eventual realization of the ambitious upside targets. Rather, it highlights the psychological aspect of trading, where partial confirmation can lend credence to an entire model, prompting a closer examination by a broader audience.
The Critical $65,000–$55,000 Zone: A Confluence of Factors
The immediate focal point of Klarck’s resurrected roadmap is not the aspirational $140,000 target, but rather the more immediate and tangible $65,000–$55,000 zone. When the roadmap was first published, a call for a decline into this region might have appeared extreme, especially if Bitcoin was trading significantly above it. However, its pertinence escalates dramatically as the actual market price draws nearer to the upper boundary of this predicted range. This specific price corridor holds significant psychological and technical importance within the Bitcoin market. Historically, levels around $65,000 have acted as both strong resistance during upward movements and robust support during corrections. For instance, in previous market cycles, these price points often coincided with critical Fibonacci retracement levels or significant moving averages, making them areas where substantial buying or selling interest could be anticipated.
If Bitcoin’s price manages to stabilize within this designated area, the roadmap’s subsequent prediction of a two-week accumulation phase becomes the next crucial element to observe. An accumulation phase, in technical analysis, is characterized by a reduction in price volatility, the formation of a tighter trading range, and a gradual shift in market sentiment as selling pressure wanes and demand begins to absorb available supply. For such a phase to truly materialize and validate Klarck’s projection, Bitcoin would need to cease making lower lows, establish a defined support base, and exhibit increasing signs that sellers are losing their dominant control over price action. This period would ideally be marked by decreasing trading volume on downward movements and increasing volume on upward pushes, signaling a potential shift in market momentum.
Conversely, should Bitcoin fail to establish firm support at the upper end of the $65,000–$55,000 zone, market participants would likely shift their attention to the lower boundary near $55,000 as the next potential liquidity target. A breakdown below the initial support would imply a continuation of bearish momentum, potentially triggering further cascade liquidations, particularly in the derivatives market. The $55,000 level also holds historical significance, having served as a pivot point in earlier market cycles. The ability or inability of Bitcoin to hold these levels will therefore be critical in determining the validity of Klarck’s full roadmap and, more broadly, the near-term trajectory of the cryptocurrency market.
Historical Context and Market Cycles in Digital Assets
The re-emergence of Klarck’s roadmap is not an isolated incident but rather a recurring theme in the fast-paced world of cryptocurrency trading. The digital asset market, particularly Bitcoin, is renowned for its cyclical nature, often influenced by events such as the halving, which reduces the supply of new bitcoins, and broader macroeconomic trends. Throughout Bitcoin’s history, various analysts and commentators have developed "cycle maps" or "roadmaps" attempting to predict future price movements based on historical patterns, technical indicators, and sometimes even esoteric models. These predictions often gain traction during periods of significant price action, whether upward or downward, as market participants seek frameworks to understand and anticipate future trends.
One prominent example of such cyclical analysis is the Stock-to-Flow model, which attempts to predict Bitcoin’s price based on its scarcity. While controversial and not without its critics, such models illustrate the community’s persistent effort to find predictive power in data. The current situation with Klarck’s roadmap echoes this sentiment, where a confluence of factors — Bitcoin’s established market history, the prevalence of technical analysis, and the inherent desire for foresight — converge to bring past predictions back into the limelight. The market’s memory, though short-term for many, often extends to well-publicized forecasts, especially when they begin to align with reality. This phenomenon is often fueled by social media, where such maps can quickly go viral, amplifying their perceived significance and potentially contributing to a self-fulfilling prophecy to some degree, as more traders become aware of and act upon the suggested levels.

Furthermore, the broader technical analysis landscape often points to similar critical zones. For example, the 200-day or 200-week moving averages are frequently cited as long-term support levels for Bitcoin. Key Fibonacci retracement levels from previous all-time highs to market cycle lows also often converge around these price areas, lending additional weight to their significance. These technical confluence points make such price ranges highly scrutinized by professional and retail traders alike, irrespective of specific roadmap predictions.
Navigating the Perils of Predictive Models: A Cautionary Perspective
While the partial validation of Klarck’s roadmap might seem compelling, it is imperative for traders and investors to approach such old forecasts with a high degree of caution and critical discernment. The digital asset markets are dynamic, influenced by a multitude of factors that are constantly evolving. Macroeconomic conditions, such as inflation rates, interest rate policies from central banks, and geopolitical stability, can rapidly shift market sentiment and liquidity flows. Regulatory developments, including new legislation or enforcement actions, can also introduce unforeseen volatility and alter market structure. Technological advancements within the crypto ecosystem, such as upgrades to blockchain protocols or the emergence of new decentralized finance (DeFi) applications, can also profoundly impact asset valuations.
The "clear danger" in over-relying on an old post lies in the fact that forecasts are snapshots in time, based on information available at that specific moment. Markets do not operate in a vacuum, and external variables can invalidate even the most meticulously crafted predictions. A "black swan" event – an unpredictable, high-impact occurrence – can entirely derail a market trajectory, rendering any prior roadmap obsolete. Therefore, treating an old forecast as a definitive trading plan is fraught with risk. Instead, a more prudent approach involves using such predictions as mere reference points within a broader analytical framework. They can help frame the price levels that the market is currently testing or approaching, offering a potential psychological anchor, but they absolutely require continuous confirmation from real-time price action, volume analysis, and an understanding of prevailing market sentiment.
Professional analysts and seasoned traders consistently advocate for a flexible approach to market analysis, emphasizing adaptability over rigid adherence to any single prediction. Diversifying sources of information, conducting independent research, and prioritizing risk management strategies are fundamental principles for navigating volatile markets. The tendency towards confirmation bias – the inclination to seek out and interpret information in a way that confirms one’s own preconceptions – can be particularly dangerous when old forecasts begin to show partial accuracy. This cognitive bias can lead investors to selectively focus on validating data while ignoring contradictory signals, potentially leading to poor decision-making.
Broader Market Dynamics and Future Prospects for Bitcoin
Beyond the specific context of Klarck’s roadmap, Bitcoin currently finds itself at a pivotal juncture in its broader market cycle. The recent halving event in April 2024, which reduced the block reward for miners by half, has historically been a precursor to significant bull runs. While the immediate impact of the halving is often muted, its long-term supply shock implications are widely debated and anticipated by market participants.
Furthermore, the introduction of spot Bitcoin Exchange-Traded Funds (ETFs) in major regulated markets earlier this year has opened up new avenues for institutional capital to flow into the cryptocurrency space. These ETFs have brought unprecedented levels of liquidity and legitimacy to Bitcoin, integrating it more deeply into traditional financial ecosystems. The inflows and outflows from these ETFs are now closely monitored as key indicators of institutional demand and sentiment, playing a significant role in price discovery.
Overall market sentiment, while prone to rapid shifts, currently reflects a mix of cautious optimism and underlying uncertainty. Indicators such as the Crypto Fear & Greed Index fluctuate, reflecting the prevailing emotional state of the market. Derivatives markets also offer insights into future expectations, with funding rates and open interest levels indicating the degree of leverage and speculative positioning.
In conclusion, Klarck’s February roadmap for Bitcoin has re-entered market discourse not as a fresh directive, but as a historical projection whose initial phases appear to be aligning with current market movements. The approach of Bitcoin to the $65,000–$55,000 downside zone, as predicted months ago, serves as a powerful reminder of how past analyses can regain relevance when validated by evolving price action. However, the true utility of such a roadmap lies in its capacity as a reference point for ongoing observation, rather than a definitive blueprint for investment. The dynamic nature of the cryptocurrency market, coupled with ever-changing macroeconomic and regulatory landscapes, necessitates continuous vigilance, real-time analysis, and a disciplined approach to risk management. Whether the remainder of Klarck’s path, including the accumulation phase and the ambitious $140,000 target, ultimately materializes remains an open and highly anticipated question, subject to the unpredictable forces of global financial markets.