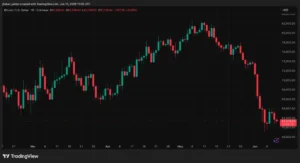
A previously published Bitcoin roadmap, articulated by crypto commentator Klarck in February, has garnered renewed attention within the digital asset community as Bitcoin’s market price has moved precisely into one of the critical downside zones highlighted months prior. This re-evaluation underscores the dynamic nature of cryptocurrency markets and the occasional validation of long-term technical projections, even if partial. The roadmap’s resurgence in relevance is not due to new analysis from Klarck, but rather the market’s current alignment with a specific phase of his earlier forecast, particularly the anticipated decline into the $65,000 to $55,000 price region.
The Genesis of Klarck’s Bitcoin Roadmap
In February, an X user operating under the handle Klarck disseminated a detailed Bitcoin roadmap that outlined a multi-phase price trajectory. The initial phase projected a significant upward movement, calling for Bitcoin to bounce towards an $83,000 valuation. Following this presumed peak, the roadmap then anticipated a gradual, sustained correction, bringing the price down into a specified range of $65,000 to $55,000. This downturn was expected to be followed by a two-week "accumulation phase," during which Bitcoin’s price would stabilize and consolidate, laying the groundwork for a subsequent resurgence into a growth trajectory. The ultimate, ambitious long-term projection within this same forecast was a target of $140,000 per Bitcoin.
It is crucial to reiterate that this roadmap is a historical document, dating back several months. Its current relevance stems not from a fresh analytical update, but from the recent price action of Bitcoin, which has brought it demonstrably closer to the upper boundary of the predicted downside range. This convergence serves as a compelling example of how market participants often revisit older cycle maps and technical analyses when current price movements begin to validate earlier forecasts. While such validation does not inherently guarantee the accuracy of the entire prediction, nor does it assure the eventual attainment of higher price targets, it undeniably brings these older models back into active market discourse.
Chronology of Bitcoin’s Journey from February to Present
To fully appreciate the renewed interest in Klarck’s roadmap, a chronological review of Bitcoin’s performance since February is essential. At the start of February 2024, Bitcoin was trading in the low to mid-$40,000s, having navigated a period of volatility following the approval of spot Bitcoin Exchange-Traded Funds (ETFs) in the United States in January.
Following Klarck’s publication, Bitcoin indeed embarked on a robust bullish ascent, surpassing many expectations. Throughout February, the cryptocurrency steadily climbed, breaching the $50,000 mark and concluding the month near $61,000. This momentum carried into March, where Bitcoin experienced a parabolic surge, ultimately establishing a new all-time high above $73,700 by mid-month. This period saw a significant influx of capital, largely driven by the sustained demand from the newly launched spot Bitcoin ETFs, which absorbed substantial amounts of BTC from the open market.
While Bitcoin did not explicitly hit Klarck’s $83,000 short-term target, its rally to over $73,000 represented a significant upward movement that could be seen as broadly consistent with the spirit of the initial bounce forecast. However, as April began, the market witnessed a cooling-off period. Profit-taking, combined with evolving macroeconomic signals and a slight deceleration in ETF inflows, led to a correction. Bitcoin’s price retreated, consolidating around the $60,000 to $65,000 range for much of April.
May brought further fluctuations. While there were attempts at recovery, pushing Bitcoin back towards the $70,000 mark at times, the overall trend leaned towards consolidation and slight downward pressure. By late May and early June, a more pronounced correction began to take hold. Several factors contributed, including anticipation surrounding upcoming macroeconomic data, a stronger dollar, and continued outflows from some legacy Bitcoin ETF products alongside reduced inflows into others. It was during this period that Bitcoin’s price dipped, bringing it squarely into the upper echelons of Klarck’s predicted $65,000 to $55,000 downside zone, specifically hovering around the $65,000 mark and occasionally dipping below it. This alignment has undeniably amplified the attention given to the old forecast.
The Critical Nature of the $65,000-$55,000 Accumulation Zone
The immediate focus for market participants is not the ambitious $140,000 long-term target, but rather the integrity and behavior within the $65,000 to $55,000 zone. This particular range holds significant technical and psychological importance. When Bitcoin was trading significantly above this range, a call for a decline into it might have appeared extreme or unlikely. However, as the price now approaches and tests the upper boundaries of this zone, its relevance intensifies.

From a technical analysis perspective, this range often represents a confluence of support levels, potentially including previous resistance turning into support, significant moving averages, or areas of high trading volume where market participants historically showed strong interest. If Bitcoin manages to stabilize within this price band, Klarck’s roadmap suggests an "accumulation phase" would follow. This phase is characterized by a reduction in volatility, a cessation of significant lower lows, and the establishment of a tighter trading range. During accumulation, selling pressure tends to diminish as buyers gradually absorb available supply without driving prices dramatically higher, signifying a potential shift in market control from sellers back to buyers. This period would be crucial for establishing a new base from which future growth could emanate.
Conversely, if Bitcoin fails to hold the upper end of this $65,000-$55,000 zone, particularly if it decisively breaks below $60,000, market sentiment could shift more negatively. Traders would then likely begin to scrutinize the lower end of the range, near $55,000, as the next potential liquidity target. A breach of this entire zone could signal deeper corrections, potentially leading to a retest of even lower support levels, altering the short-to-medium-term bullish outlook considerably.
Broader Market Context and Supporting Data
The current price action and the potential for an accumulation phase are influenced by a complex interplay of macroeconomic factors and on-chain dynamics.
- Macroeconomic Environment: The Federal Reserve’s stance on interest rates remains a dominant factor. Persistent inflation data and a cautious approach to rate cuts can strengthen the U.S. dollar, which historically tends to exert downward pressure on risk assets like Bitcoin. Conversely, any dovish signals or actual rate cuts could provide a tailwind. Global economic stability, geopolitical events, and energy prices also contribute to the broader risk appetite among institutional investors.
- Spot ETF Flows: The performance of U.S. spot Bitcoin ETFs continues to be a critical indicator. Sustained net inflows signal strong institutional demand and provide buying pressure. Any significant net outflows, or a prolonged period of stagnant inflows, can indicate waning institutional interest or profit-taking, which would naturally impact Bitcoin’s price and its ability to hold support zones.
- On-Chain Analysis: On-chain data provides deeper insights into market structure. Metrics such as exchange net flows can reveal whether market participants are moving Bitcoin off exchanges (accumulation, bullish) or onto exchanges (preparation to sell, bearish). Long-term holder (LTH) behavior, specifically whether these experienced investors are accumulating or distributing their holdings, offers clues about conviction. Periods of LTH accumulation often precede price increases, while distribution can signal potential tops. Miner capitulation or holding patterns also play a role; if miners are forced to sell their BTC to cover operational costs, it adds to selling pressure. Conversely, miner accumulation can reduce supply. Monitoring these metrics within the $65,000-$55,000 range would be vital to confirm an accumulation phase.
- Technical Indicators: Beyond simple price levels, traders also watch other technical indicators. The 200-day and 200-week moving averages are often considered significant long-term support levels. Oscillators like the Relative Strength Index (RSI) can indicate whether Bitcoin is oversold or overbought, while volume profiles within the $65,000-$55,000 range can highlight areas of strong historical buying or selling interest.
Expert Perspectives and the Prudence of Dated Forecasts
Market analysts frequently underscore the inherent volatility and rapid evolution of the cryptocurrency landscape. While a dated forecast like Klarck’s can offer intriguing parallels to current price action, industry commentators consistently caution against assigning undue weight to any single, historical prediction. Markets are living entities, constantly adapting to new information, shifts in global macroeconomic conditions, regulatory developments, and changes in liquidity dynamics. A forecast, however prescient it may appear at one juncture, can quickly become outdated or invalidated by unforeseen events.
Many seasoned market observers emphasize that while such roadmaps can serve as valuable reference points for understanding potential market structures or identifying key price levels, they should never be treated as definitive trading plans. Relying solely on a historical projection without integrating real-time analysis, current market sentiment, and evolving fundamental data exposes investors to significant risk. The "Trusted Editorial" process, as highlighted in the original source, emphasizes diligent review by experts, a practice that underpins the need for continuous, current analysis rather than static adherence to old models.
The more judicious approach involves using such historical calls to frame the levels the market is currently testing. This means using the $65,000-$55,000 zone as a hypothesis for an accumulation phase, which then requires active confirmation through current price action, trading volume, on-chain metrics, and the broader macroeconomic narrative. The market’s reaction to these levels – whether it holds, bounces, or breaks – provides the critical, real-time feedback necessary for informed decision-making.
Implications and Future Outlook
The implications of Bitcoin’s current position relative to Klarck’s February roadmap are multifaceted. If Bitcoin successfully stabilizes within the $65,000-$55,000 range and initiates a visible accumulation phase, it could significantly bolster market confidence. This scenario would suggest a healthy correction, allowing for the absorption of selling pressure and the establishment of a robust base for future upward movement. Such a development would lend some, albeit cautious, credibility to the longer-term bullish target of $140,000, signaling that the broader market structure remains intact for a continuation of the bull cycle.
Conversely, a decisive break below the $55,000 level could trigger further panic selling, leading to a re-evaluation of the entire bullish thesis. It would indicate that the selling pressure is stronger than anticipated, potentially pushing Bitcoin towards lower support levels, possibly in the $50,000 or even $40,000 range. This would necessitate a complete recalibration of market expectations and likely prolong any recovery period.
For now, Klarck’s February roadmap has undeniably re-entered the market conversation due to Bitcoin’s proximity to the first major downside zone he accurately described. Whether the subsequent phases of his prediction – particularly the accumulation phase and the ambitious $140,000 target – ultimately materialize remains an open and highly debated question, contingent upon the dynamic interplay of market forces, investor sentiment, and global economic conditions. The market will be watching closely to see if history, in this instance, continues to rhyme.