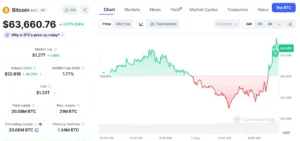
Bitcoin’s price action has notably shifted from the euphoric highs that characterized earlier periods, settling below the levels that previously instilled confidence in bullish investors. The leading cryptocurrency has now descended into a critical Dollar-Cost Averaging (DCA) zone, a region historically associated with peak market fear and the quiet formation of long-term investment opportunities. This phenomenon, highlighted by various market analysts, suggests a potential inflection point where accumulation by astute investors typically precedes significant rallies.
The Strategic Significance of the Dollar-Cost Averaging Zone
The concept of a DCA zone in cryptocurrency markets refers to a specific price range where asset prices have corrected substantially, leading to widespread bearish sentiment and often, capitulation among less resilient holders. For long-term investors employing a dollar-cost averaging strategy—consistently investing a fixed amount of money at regular intervals, regardless of the asset’s price—these periods are considered opportune. By acquiring assets during these dips, investors aim to lower their average purchase price over time, thereby maximizing potential returns when the market eventually recovers. Analyst Ardizor, commenting on X, underscored that Bitcoin’s current positioning mirrors these historical DCA zones that have invariably preceded major recoveries in previous market cycles. This pattern is often characterized by a prevailing narrative declaring Bitcoin "dead," followed by its entry into this long-term accumulation region, and ultimately, a surge to new all-time highs.
Echoes from the Past: The 2019 Accumulation Phase
One of the most compelling historical parallels to Bitcoin’s current situation can be found in the 2019 market cycle. Following the monumental bull run of 2017, which saw Bitcoin reach an approximate peak of $19,000, the cryptocurrency entered a prolonged bear market often dubbed the "crypto winter." This period was marked by an arduous decline, with Bitcoin’s price plummeting by over 83% from its peak. Sentiment was overwhelmingly negative, characterized by widespread skepticism regarding Bitcoin’s long-term viability and pronouncements of its impending demise. It was precisely within this environment of profound fear and despair that Bitcoin entered a depressed DCA accumulation area. Throughout much of 2019, prices lingered in this low range, offering consistent opportunities for patient investors to accumulate. This protracted accumulation phase laid the groundwork for the subsequent multi-year bull market, which eventually propelled Bitcoin to its then-unprecedented all-time high of approximately $69,000 in late 2021. The 2019 period serves as a potent reminder that the deepest valleys of market sentiment often conceal the most fertile grounds for future growth. During this time, trading volumes often contracted, and mainstream media attention waned, creating an environment where fundamental value slowly began to assert itself over speculative fervor. Early signs of institutional interest, albeit nascent, also began to emerge, quietly setting the stage for broader adoption.

The 2022 Cycle: A Shorter, Sharper Accumulation
The market dynamics of 2022 presented another, albeit shorter in duration, structurally identical pattern. After reaching its 2021 peak above $69,000, Bitcoin experienced another significant downturn, exacerbated by a confluence of macroeconomic headwinds and crypto-specific crises. The collapse of the Terra-Luna ecosystem in May 2022 and, critically, the implosion of the FTX exchange in November of the same year, sent shockwaves through the entire cryptocurrency market. These events triggered a wave of forced selling and a dramatic loss of confidence, driving Bitcoin’s price down to approximately $15,500. The FUD (fear, uncertainty, and doubt) was pervasive, and many analysts and investors anticipated even further declines. Yet, amidst this extreme capitulation, Bitcoin once again entered a recognizable DCA zone. Despite the intense fear and the seemingly insurmountable challenges, resilient investors and long-term holders began to accumulate. This period of intense, albeit brief, accumulation ultimately preceded a powerful recovery. From its 2022 lows, Bitcoin embarked on a remarkable rally, eventually surpassing $100,000 and achieving a new all-time high above $126,000 by October 2025. This impressive surge, representing an almost 600% increase from the 2022 bottom, rewarded those who demonstrated conviction during the market’s darkest hours. The 2022 episode highlighted the accelerated nature of crypto cycles, demonstrating that even sharp, crisis-induced downturns can quickly pivot into significant growth opportunities for those positioned strategically.
Current Market Landscape: Bitcoin at $62,800
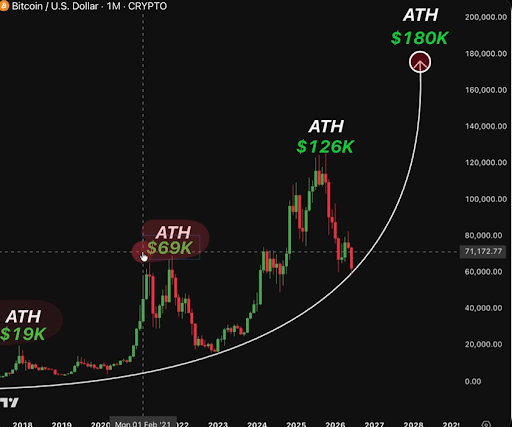
As of the current assessment, Bitcoin is trading around $62,800, positioned precisely within the curved support structure visible on the monthly price chart, as highlighted by Ardizor’s analysis. This level is crucial, as its ability to hold will dictate whether the current cycle can effectively mirror the accumulation phases of 2019 and 2022. The market sentiment is far from the euphoria witnessed during previous bull runs, and prices are not comfortably above the thresholds that buoyed bullish confidence earlier in the year. Instead, a palpable sense of caution, if not outright fear, pervades the market. The comparison to previous cycles suggests that this environment, while challenging for short-term traders, presents a familiar setup for long-term investors. The core argument rests on the premise that as long as Bitcoin continues to respect this established long-term structural support, the historical pattern of "market declared dead," "entry into DCA zone," and "subsequent rally to new all-time highs" remains a highly probable outcome. This current juncture is a test of investor resolve, separating those driven by fleeting sentiment from those committed to a long-term vision.
Contrasting Indicators: Bearish Headwinds and Their Nuance
Despite the compelling historical comparisons suggesting an accumulation opportunity, the current market is not without its bearish pressures. Inflows into spot Bitcoin Exchange-Traded Funds (ETFs), which had been a significant bullish catalyst earlier in the year, have recently shown signs of weakening, and at times, even turning negative. This shift indicates a reduction in institutional buying pressure, which can weigh on price action. Furthermore, on-chain analytics provide a mixed picture. Bitcoin’s Realized Cap, a metric that reflects the total value of all coins at the price they were last moved, has seen a decline of approximately $12 billion from its mid-May peak. This reduction often signals a period of de-risking or profit-taking by longer-term holders, or even forced selling, contributing to downward price momentum. Another critical on-chain metric, the Bitcoin PnL Index—which aggregates various profit and loss indicators—suggests that Bitcoin has not yet definitively reached a market bottom, although it is currently in a "transition phase." This implies that while the worst may not be over, the market is moving towards a potential turning point.

However, these seemingly bearish signals do not necessarily invalidate the DCA-zone argument; in fact, they may strengthen the comparison with past cycles. The accumulation zones of 2019 and 2022 did not manifest during periods of market tranquility or universal optimism. On the contrary, they emerged amidst thin liquidity, heightened uncertainty, and widespread expectations for further price declines. During those times, many traders and analysts were still anticipating deeper bottoms, only for the market to eventually reverse course. The current environment, characterized by a mix of fundamental strength and prevailing fear, aligns perfectly with the psychological backdrop of previous successful accumulation phases. The very presence of bearish pressure, waning euphoria, and calls for lower prices often create the ideal conditions for a DCA zone, as it discourages weak hands and allows patient capital to enter at discounted valuations.
The Macroeconomic Undercurrents and Market Psychology
The current state of the Bitcoin market cannot be entirely divorced from broader macroeconomic conditions. Global economic uncertainty, inflation concerns, interest rate policies by central banks, and geopolitical tensions all contribute to a risk-off sentiment that can impact volatile assets like cryptocurrencies. When global liquidity tightens, speculative assets often bear the brunt of capital flight. These macro factors, while not explicitly detailed in the original analysis, implicitly contribute to the "thin liquidity" and "fear" noted during past accumulation phases. Understanding this interplay is crucial for comprehending why a DCA zone forms—it’s not merely internal crypto dynamics but also external economic pressures creating an environment ripe for capitulation.
From a psychological perspective, the DCA zone represents a fascinating interplay between fear and opportunity. The "Fear & Greed Index," a popular sentiment gauge in crypto, typically bottoms out during such periods, reflecting extreme fear. Yet, it is precisely when fear is at its peak that the greatest long-term opportunities often arise. This contrarian approach, advocated by legendary investors, suggests that buying when others are fearful is a cornerstone of successful investing. Institutions, often with longer investment horizons and more sophisticated risk management, are increasingly looking at these dips as strategic entry points, differentiating them from retail investors who might be more susceptible to emotional trading. The sustained buying power from these larger entities, even if not always reflected in immediate price surges, gradually builds a stronger foundation for future rallies.
Technical Analysis: Decoding the Curved Support
The monthly candlestick chart analysis, particularly the "curved support" mentioned, is a critical technical indicator for understanding Bitcoin’s current position. This curved support likely represents a long-term moving average (such as the 200-week or 300-week moving average) or a multi-year trendline that has historically acted as a significant floor for Bitcoin’s price during bear markets. Such moving averages are dynamic and adjust with price action, providing a resilient support level over extended periods. When Bitcoin retests and holds these long-term supports, it signals a potential rebound area. Volume analysis during these accumulation phases typically shows a decrease in selling pressure accompanied by a gradual, often stealthy, increase in buying volume from long-term holders. Other technical indicators, such as the Relative Strength Index (RSI) on higher timeframes (monthly/weekly), often enter oversold territory, signaling that the asset is undervalued relative to its historical performance. Metrics like the MVRV Z-Score and the Puell Multiple also tend to dip into "buy zones" during these periods, reinforcing the idea that the asset is trading below its fair value and offering attractive entry points for patient investors.
Implications for Diverse Investor Profiles
The current DCA zone carries different implications for various types of investors. For long-term holders, this period is an ideal time to continue or initiate their accumulation strategy, confident in Bitcoin’s long-term value proposition. The goal is to average down their cost basis, thereby enhancing potential returns in future bull markets. Short-term traders, however, might find these periods challenging, characterized by heightened volatility, choppy price action, and difficulty in predicting immediate directional moves. For them, a cautious approach, focusing on smaller positions or waiting for clearer signs of market reversal, would be prudent. The broader market implications are significant: if Bitcoin successfully navigates this DCA zone and initiates another rally, it often signals a resurgence across the entire cryptocurrency ecosystem, leading to an "altcoin season" where other digital assets also experience substantial gains. Conversely, a failure to hold this critical support could indicate a deeper and more prolonged bear market, requiring a reassessment of investment strategies.
Expert Outlook and Concluding Thoughts
The analysis by Ardizor and the historical precedents paint a compelling picture for Bitcoin’s current market positioning. While the immediate future remains uncertain due to contrasting signals from ETF flows and on-chain metrics, the structural integrity of the DCA zone, if maintained, points towards a significant long-term opportunity. The current price of $62,800, resting on the crucial curved support, represents a pivotal moment. As long as Bitcoin continues to respect this long-term structure, the comparison with the robust accumulation phases of 2019 and 2022 remains highly relevant and indicative of potential future growth. The market is currently undergoing a test of conviction, where fear and uncertainty create fertile ground for those with a strategic, long-term perspective. The historical pattern suggests that those who embrace the DCA strategy during these periods of market despair are often the ones who reap the most substantial rewards when the market inevitably transitions back to euphoria. This cyclical nature underscores the resilience of Bitcoin and its consistent ability to rebound from periods of extreme capitulation, offering patient investors a unique opportunity to build wealth.