Bitcoin’s recent price action signals a departure from the bullish euphoria that characterized earlier periods of the year, settling instead into a crucial Dollar-Cost Averaging (DCA) zone. This specific price region has historically emerged during periods of suppressed market sentiment, often preceding significant long-term accumulation opportunities for discerning investors. The current positioning suggests a potential inflection point, where market fear might be nearing its peak, setting the stage for future growth.
The concept of a DCA zone is central to understanding Bitcoin’s current market dynamics. Dollar-cost averaging is an investment strategy in which an investor divides the total amount to be invested across periodic purchases of a target asset to reduce the impact of volatility. By buying at regular intervals, regardless of price, investors aim to mitigate the risk of making a single, poorly timed investment. When an asset enters a "DCA zone," it typically implies that the price has fallen significantly from previous highs, is trading at a discount, and market sentiment is largely negative, leading long-term holders and institutional players to view it as an opportune period for systematic accumulation. This methodical approach stands in stark contrast to the impulsive buying often seen during periods of market euphoria.
Historical Precedents: A Cyclical Pattern of Fear and Accumulation
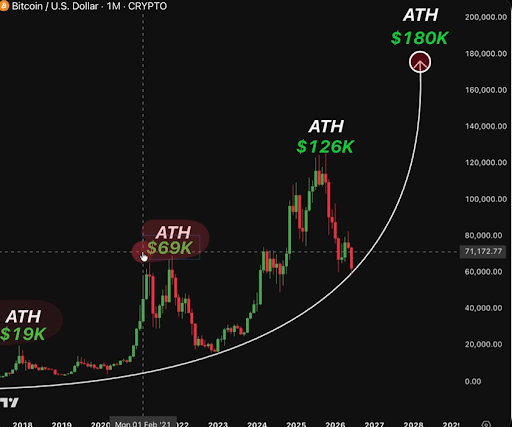
Prominent crypto analyst Ardizor recently highlighted on X (formerly Twitter) that Bitcoin has re-entered a DCA zone reminiscent of those observed before major recoveries in previous market cycles. This observation underscores a recurring pattern: a period where the market widely declares Bitcoin’s demise, followed by its price descending into a long-term accumulation region, and ultimately culminating in a rally to new all-time highs. Understanding these historical cycles provides essential context for the current market situation.
The first significant historical parallel can be drawn from the aftermath of Bitcoin’s initial major bull run. Following its peak around $19,000 in December 2017, the cryptocurrency entered a prolonged bear market, often referred to as the "crypto winter." This period saw Bitcoin’s price plummet by over 83%, reaching lows around $3,200 in December 2018. The sentiment was overwhelmingly negative, with many critics declaring the end of Bitcoin. However, by 2019, the price began to stabilize within a distinct accumulation area. This phase, characterized by thin liquidity and widespread investor capitulation, eventually paved the way for the monumental rally that propelled Bitcoin to its then-unprecedented all-time high of approximately $69,000 in November 2021. This cycle demonstrated the power of the DCA zone as a foundation for future parabolic growth.

A more recent and structurally similar episode occurred in 2022. After the 2021 peak, Bitcoin experienced another significant downturn. The collapse of major entities like Terra/Luna, Three Arrows Capital (3AC), Celsius Network, and most notably, the FTX exchange in November 2022, triggered a cascade of forced selling and widespread panic. Bitcoin’s price plummeted from its $69,000 peak to around $15,500. This period was marked by extreme fear and a profound loss of confidence across the crypto ecosystem. Yet, even amidst this turmoil, a resilient base of accumulators recognized the long-term opportunity. As the market bottomed out and entered another DCA zone, these investors began to systematically acquire Bitcoin. The subsequent recovery from this accumulation phase saw Bitcoin embark on a significant rally, eventually surpassing the $100,000 mark and, according to some analyses presented in the original chart’s projection, potentially reaching above $126,000 by October 2025. This rapid and substantial rebound reinforced the notion that these periods of extreme fear and accumulation are critical for setting up future price appreciation.
Current Market Position and Technical Analysis
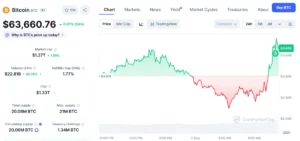
Presently, Bitcoin is trading around $62,800, positioned precisely within the curved support indicated on the monthly chart. This adherence to a long-term structural support level strengthens the comparison to the 2019 and 2022 accumulation phases. The current price action is not indicative of widespread bullish momentum, but rather a consolidation, where the market is absorbing selling pressure and forming a base.
Technical indicators corroborate this cyclical perspective. The monthly candlestick chart, as highlighted by Ardizor, provides a macro view of Bitcoin’s price trajectory across these three distinct cycles. The consistent appearance of this specific accumulation zone, identified by its characteristic price depression and subsequent recovery, offers a compelling argument for its significance. Should Bitcoin continue to respect this long-term structure, the historical parallels suggest that the market may be in the midst of another foundational accumulation phase.
Divergent Signals: ETF Flows and On-Chain Metrics
While the historical pattern suggests a bullish long-term outlook, several contemporary market indicators introduce a degree of bearish pressure, creating a complex environment. These divergent signals, however, do not necessarily invalidate the DCA-zone argument; rather, they often reinforce the conditions under which such zones typically form.

One significant factor is the behavior of Bitcoin Exchange Traded Funds (ETFs). Since their approval in early 2024, these ETFs have become a major conduit for institutional capital into Bitcoin. Recent data has shown periods of net outflows from these ETFs, indicating a reduction in institutional buying interest or even profit-taking, which can exert downward pressure on prices. For instance, Bitcoin’s Realized Cap, a metric representing the aggregate cost basis of all coins in circulation, has reportedly declined by approximately $12 billion from its mid-May peak. A decreasing Realized Cap often signifies that coins are moving from higher-cost buyers to lower-cost buyers, or that long-term holders are selling, which can be interpreted as a capitulation event or a re-distribution phase.
Furthermore, an analysis of Bitcoin’s PnL (Profit and Loss) Index, which aggregates various on-chain data metrics, suggests that the market may not have reached a definitive bottom yet, even though it is currently in a "transition phase." The PnL Index typically identifies market bottoms when a significant portion of the supply is held at a loss, leading to capitulation. While the current state indicates a shift, it has not yet confirmed the full extent of potential downside, implying that further price discovery or consolidation might occur within this DCA zone.
These bearish signals—ETF outflows, a declining Realized Cap, and an unconfirmed market bottom via the PnL Index—might seem contradictory to a bullish accumulation thesis. However, this is precisely the environment in which DCA zones historically thrive. The 2019 and 2022 accumulation phases did not unfold under calm, optimistic conditions. Instead, they emerged when liquidity was thin, market participants were experiencing peak fear, and many traders were still anticipating further price drops. The current confluence of bearish pressures and a resilient long-term support level aligns perfectly with this historical pattern, suggesting that the current DCA zone is being formed amidst the very uncertainty that defines such periods of opportunity.
Broader Impact and Implications
The implications of Bitcoin entering this DCA zone are multifaceted, impacting various segments of the market and shaping future investment strategies.
For long-term investors and institutional accumulators, this period is viewed as a strategic opportunity. These entities typically employ a long-term horizon, focusing on Bitcoin’s fundamental value proposition as digital gold and a decentralized store of value. Periods of price depression, coupled with a decline in euphoric sentiment, allow them to acquire assets at a perceived discount, building stronger positions for the next bull cycle. The presence of institutional vehicles like spot Bitcoin ETFs, despite recent outflows, provides a more accessible and regulated avenue for such accumulation compared to previous cycles.
For short-term traders and speculative investors, the DCA zone can be characterized by increased volatility and uncertainty. While the long-term outlook might be bullish, the short-term price action within this zone can be choppy, with rapid fluctuations driven by news, macro events, and shifts in sentiment. This environment demands caution and a clear trading strategy, as attempting to time the exact bottom can be challenging.
The overall market structure is also undergoing an evolution. The increasing influence of institutional capital, as evidenced by ETF flows, introduces new dynamics compared to earlier, primarily retail-driven cycles. While retail investors still play a significant role, institutional participation can potentially create more robust price floors and reduce extreme volatility in the long run, even during accumulation phases. However, it also means that Bitcoin’s price is increasingly correlated with broader macroeconomic trends and traditional financial market sentiment.
Looking ahead, the critical question revolves around Bitcoin’s ability to sustain its position within this DCA zone. As long as the cryptocurrency continues to respect the long-term structural support, the historical parallels remain compelling. A successful hold could pave the way for a gradual rebuilding of confidence, followed by renewed upward momentum driven by future catalysts such as the ongoing adoption of Bitcoin, potential regulatory clarity, and a favorable macroeconomic environment.
Conversely, a failure to hold this key support level could lead to a deeper capitulation, pushing prices lower and extending the accumulation phase. Such a scenario, while painful in the short term, would likely only intensify the long-term accumulation opportunity for those with conviction, mirroring the extreme fear and subsequent rebounds of past cycles. The current market environment, characterized by a mix of historical pattern recognition and contemporary pressures, demands vigilance and a strategic, long-term perspective from investors. The coming months will be crucial in determining whether Bitcoin is indeed forming the bedrock for its next significant rally from this critical DCA zone.