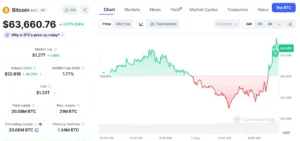
A vintage Bitcoin roadmap, originally disseminated by the crypto commentator Klarck in February, is currently undergoing an intense re-evaluation within the digital asset community. This renewed scrutiny comes as Bitcoin’s price trajectory has remarkably converged with one of the key downside zones that Klarck had meticulously outlined months prior. The coincidence has sparked considerable discussion among traders and analysts, highlighting the enduring, albeit often debated, utility of technical forecasts in a notoriously volatile market.
Klarck’s February Roadmap: A Detailed Foresight
In February, amidst a prevailing wave of optimism following the approval of spot Bitcoin Exchange-Traded Funds (ETFs) in the United States and the anticipation of the quadrennial halving event, Klarck, a prominent voice on the X platform (formerly Twitter), published a comprehensive outlook for Bitcoin. His roadmap charted a specific course: an initial rebound in Bitcoin’s value, targeting an approximate $83,000, followed by a gradual yet significant correction. This correction was projected to lead Bitcoin into a critical downside region, specifically between $65,000 and $55,000. Following this descent, Klarck’s prediction then posited a crucial "two-week accumulation phase" within this very range, setting the stage for a subsequent resurgence into a growth trajectory, ultimately culminating in an ambitious long-term projection of $140,000 per BTC.
It is paramount to underscore that this forecast is not fresh market commentary. Its initial publication date in February means it was formulated under distinct market conditions and sentiment. Therefore, its current relevance stems not from a new signal or an updated analyst brief, but rather from the compelling fact that Bitcoin’s recent price action has brought it remarkably close to the upper echelons of the predicted downside range. This convergence serves as a potent illustration of how market participants often revisit historical cycle maps when the live price action begins to validate specific segments of a previously laid-out path. While such validation does not inherently guarantee the accuracy of the entire prediction, nor does it assure the eventual attainment of the audacious $140,000 upside target, it undeniably reinserts the old technical roadmap into contemporary market discourse, prompting a deeper examination of its implications.
The Journey to the Predicted Zone: A Chronology of Bitcoin’s Price Action
To fully appreciate the significance of Klarck’s resurfaced roadmap, it is essential to contextualize Bitcoin’s journey since February. The period immediately following Klarck’s initial post was characterized by a robust bullish momentum. Bitcoin, having already seen substantial gains in late 2023 and early 2024, continued its ascent, fueled by sustained inflows into the newly launched spot Bitcoin ETFs. These investment vehicles democratized access to Bitcoin for institutional and retail investors alike, channeling unprecedented capital into the asset class. By mid-March, Bitcoin successfully breached its previous all-time high from November 2021, surging past $69,000 and ultimately reaching a new peak of approximately $73,794. This impressive rally saw Bitcoin not only achieve but exceed the initial "bounce towards $83,000" aspect of Klarck’s prediction in terms of general upward momentum, if not the exact numerical target.
However, the relentless upward trajectory began to falter in late March and early April. Several factors converged to trigger a market correction. Profit-taking became increasingly prevalent as investors cashed in on significant gains. Geopolitical tensions, particularly escalating conflicts in the Middle East, introduced a layer of global uncertainty, leading investors to de-risk across various asset classes, including cryptocurrencies. Furthermore, a deceleration in the pace of net inflows into Bitcoin ETFs, and in some instances, temporary outflows, signaled a cooling of institutional enthusiasm. Macroeconomic concerns also played a role; persistent inflation data and the Federal Reserve’s cautious stance on interest rate cuts dampened overall risk appetite.
This confluence of events initiated a gradual yet persistent decline in Bitcoin’s value throughout April and into May. From its mid-March peak, Bitcoin began its descent, steadily losing ground. It was during this period that the price action began to align eerily with the "gradual drop to the $65,000-$55,000 region" forecast by Klarck. By late April and early May, Bitcoin had decisively moved below the $70,000 mark and subsequently breached the $65,000 threshold, bringing it directly into the upper boundary of Klarck’s predicted downside zone. This precise timing and alignment are what have propelled the February roadmap back into the spotlight, transforming it from a historical artifact into a relevant point of reference for contemporary market analysis.
Deconstructing the $65,000-$55,000 Support Range
The immediate focal point for traders and analysts is no longer the aspirational $140,000 target, but rather the integrity and significance of the $65,000-$55,000 zone. A call for a decline into this region might have appeared extreme or even improbable when Bitcoin was trading significantly above it. However, its relevance has dramatically escalated as the price has converged with the upper boundary of this range. From a technical analysis perspective, such a zone can represent a confluence of significant support levels. Historically, previous resistance levels often transform into support once decisively broken and retested. Furthermore, psychological price points, often rounded numbers like $60,000 or $55,000, can attract substantial buying interest and act as magnets for liquidity.
If Bitcoin demonstrates stability within this crucial area, the subsequent phase outlined in Klarck’s roadmap—the "accumulation phase"—becomes the next critical element to observe. For an accumulation phase to manifest effectively, several conditions would need to be met in terms of price action. Bitcoin would ideally need to cease its pattern of making successive lower lows, indicating a loss of momentum for sellers. Concurrently, it would need to establish a tighter trading range, characterized by reduced volatility and a more consolidated price action. This period would typically involve a battle between buyers and sellers, with buyers gradually absorbing selling pressure without significant price depreciation. Signs that sellers are losing control, such as declining selling volume on downward movements and increasing buying volume on upward tests, would further validate an accumulation narrative.
Conversely, if Bitcoin fails to hold the upper end of the $65,000-$55,000 zone, market participants would logically shift their focus to the lower boundary near $55,000. A breakdown below $65,000 could trigger further selling pressure, as stop-loss orders are activated and market sentiment sours. In such a scenario, $55,000 would become the next significant liquidity target, potentially drawing price action down to retest that level as a critical support. On-chain metrics could offer additional insights during this period. For instance, monitoring the "realized price" of various cohorts of holders (e.g., short-term vs. long-term holders) could reveal where significant amounts of Bitcoin were last moved, indicating potential cost bases that might act as strong support or resistance. Similarly, tracking exchange flows could indicate whether whales are accumulating or distributing Bitcoin within this range.
The Broader Market Landscape and Macroeconomic Influences

The market environment in which Klarck’s roadmap is being re-evaluated is multifaceted, shaped by a confluence of internal crypto dynamics and broader macroeconomic forces. The initial euphoria surrounding Bitcoin spot ETFs has, to some extent, moderated. While these products continue to attract investments, the record-breaking inflows observed in the first few weeks have tapered off, leading to periods of net outflows on certain days. This shift suggests a more mature, perhaps more discerning, institutional participation, rather than a continuous, parabolic influx.
The Bitcoin Halving, which occurred in mid-April, is another significant event that has influenced the market. Historically, halvings have been catalysts for major bull runs, as the supply of new Bitcoin entering the market is suddenly cut in half. However, in this cycle, the "halving rally" appears to have been somewhat front-run by the ETF approvals, leading to a "buy the rumor, sell the news" type of reaction. While the long-term supply-side impact of the halving remains bullish, its immediate effect on price action has been less pronounced than in previous cycles, contributing to the recent consolidation and correction.
Global macroeconomic conditions continue to cast a long shadow over risk assets like Bitcoin. Persistent inflation figures in major economies, particularly the United States, have led central banks, including the Federal Reserve, to maintain higher interest rates for longer than initially anticipated. This "higher for longer" narrative for interest rates makes risk-free assets (like government bonds) more attractive relative to volatile assets like Bitcoin, potentially drawing capital away from the crypto market. Additionally, geopolitical events, such as the ongoing conflicts in Eastern Europe and the Middle East, introduce significant uncertainty into global financial markets. During periods of heightened geopolitical risk, investors often flock to traditional safe-haven assets, such as the U.S. dollar or gold, at the expense of more speculative investments like cryptocurrencies. The strength of the U.S. dollar, often inversely correlated with Bitcoin’s price, also plays a crucial role. A stronger dollar can put downward pressure on Bitcoin, as it makes dollar-denominated assets less attractive for international investors.
Expert Perspectives and Cautionary Notes on Predictive Models
The resurgence of Klarck’s roadmap underscores a fundamental aspect of market analysis: the human desire to identify patterns and predict future movements. However, market observers and leading industry experts universally caution against giving undue weight to any single, older forecast. Markets are dynamic ecosystems, constantly evolving under the influence of new information, shifting macro conditions, and the ever-present ebb and flow of liquidity. A prediction that appears remarkably accurate for a period can swiftly break down when unforeseen variables emerge or when the underlying market structure changes.
Analysts frequently emphasize that while technical roadmaps can serve as valuable reference points, they should never be treated as definitive trading plans. Their utility lies in helping to frame potential support and resistance levels, offering a conceptual framework for market movements, and providing a basis for discussion. However, any such forecast necessitates continuous confirmation from current price action and confluence with a broader array of indicators, including on-chain data, volume analysis, and fundamental developments.
The concept of "market reflexivity" also comes into play. When a particular prediction gains widespread attention, it can, paradoxically, influence market behavior. If a significant number of traders become aware of a predicted support zone, their collective actions (e.g., placing buy orders at that level) could contribute to making it a self-fulfilling prophecy. Conversely, if a prediction becomes too widely anticipated, smart money might front-run or even attempt to invalidate it to gain an edge. Therefore, analysts often highlight that while Klarck’s roadmap provides an intriguing framework, it is crucial for investors to conduct their own diligent research, consider a comprehensive range of market data, and remain adaptable to changing conditions. The market environment today, with its specific macroeconomic headwinds and evolving institutional landscape, is markedly different from that of February.
Implications for Traders and Investors
For short-term traders, the $65,000-$55,000 zone represents a critical juncture. It could either serve as a robust bounce point, signaling a temporary relief rally or the beginning of an accumulation phase, or it could prove to be a weak support, leading to a further breakdown. Traders will be closely monitoring price action within this range for signs of capitulation, demand absorption, or decisive breakdowns. Risk management, including the strategic placement of stop-loss orders and careful position sizing, becomes paramount in such volatile conditions. The clarity provided by a pre-defined range, even from an old forecast, can help in structuring trading strategies around potential entry and exit points.
For long-term investors, the current market situation, particularly if Bitcoin stabilizes within the predicted downside zone, could present opportunities for dollar-cost averaging. Periods of consolidation or moderate corrections are often viewed by long-term holders as chances to accumulate more Bitcoin at potentially favorable prices, especially if they maintain a strong conviction in its long-term value proposition. For these investors, the $140,000 target remains a long-term aspiration, contingent on Bitcoin successfully navigating the current challenges and subsequently resuming its upward trajectory. The psychological impact of such "validated" predictions can be significant, potentially fueling both fear of missing out (FOMO) if the price rebounds, and fear, uncertainty, and doubt (FUD) if it breaks down further. Maintaining a disciplined investment strategy, independent of short-term market noise, is crucial.
Conclusion: Navigating the Uncertainty
The re-emergence of Klarck’s February Bitcoin roadmap serves as a compelling case study in the cyclical nature of market commentary and the enduring fascination with predictive models. While the roadmap has demonstrated an intriguing degree of accuracy in partially aligning with Bitcoin’s recent price movements, particularly in pinpointing the current downside zone, the future trajectory of the cryptocurrency remains inherently uncertain. The validation of one part of a prediction does not automatically guarantee the fulfillment of the entire forecast, especially the ambitious $140,000 target.
Ultimately, the current situation underscores the necessity for adaptability, continuous market analysis, and a healthy skepticism towards singular predictions, regardless of their past accuracy. The digital asset market is influenced by a complex interplay of technical indicators, on-chain metrics, macroeconomic forces, and evolving market sentiment. While historical forecasts like Klarck’s roadmap can re-enter the market dialogue and offer a valuable framework for understanding potential price action, they must always be weighed against the most current data and a broader understanding of market dynamics. The journey through the $65,000-$55,000 zone will be keenly watched, serving as a critical test for Bitcoin’s short-term resilience and a crucial determinant for the viability of its longer-term aspirations.