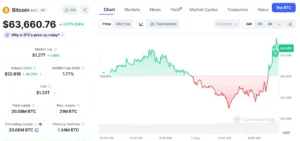
As cryptocurrency markets continue to experience periods of intense volatility, market participants frequently scour historical charts, archived social media posts, and older technical roadmaps to find parallels for current price action. Recently, a specific Bitcoin trajectory shared by crypto commentator Klarck back in February has resurfaced across digital asset forums and social media platforms. The renewed interest is not born out of a fresh analytical update, but rather because Bitcoin’s recent market correction has brought the asset dangerously close to the primary downside zone predicted in the months prior.
While seasoned market analysts consistently warn against treating archived forecasts as active trading signals, the uncanny alignment between the early-year roadmap and current market behavior has sparked widespread debate. Examining how old roadmaps return to the spotlight provides valuable insight into trader psychology, technical analysis utility, and the broader macroeconomic factors currently governing the world’s leading cryptocurrency by market capitalization.
The Genesis of the Klarck Roadmap: A Timeline of Predictions
The origin of the discussion traces back to February, a period characterized by shifting sentiment within the digital asset ecosystem. During this time, crypto commentator Klarck published a detailed multi-phase Bitcoin roadmap on the social media platform X (formerly Twitter). The projection was intricate, outlining a sequence of price movements that many market participants initially viewed as overly aggressive or deeply pessimistic depending on the prevailing market trend.
According to Klarck’s original thesis, Bitcoin was initially slated to stage a relief bounce toward the $83,000 threshold. Following this upward push, the roadmap anticipated a gradual, sustained retracement dragging the asset down into a broader accumulation corridor situated between $65,000 and $55,000. Within this forecasted zone, the roadmap predicted a stabilization period lasting approximately two weeks, acting as a base for an eventual market consolidation. Finally, the long-term portion of the projection envisioned a significant structural breakout, targeting a staggering $140,000 per Bitcoin as the cycle matured.
For months, as the market fluctuated through various macroeconomic headwinds and regulatory developments, the post remained a relatively obscure piece of archived analysis. However, as Bitcoin recently encountered sustained downward pressure, sliding from its local highs toward the upper boundaries of the projected correction zone, market participants began dusting off the old chart. The convergence of actual price action with the theoretical levels outlined months prior transformed a forgotten post into a trending topic of conversation across technical analysis circles.
Decoding the Critical $65,000 to $55,000 Range
At the core of the renewed attention is the specific price band identified in Klarck’s roadmap: the $65,000 to $55,000 region. When a technical analyst or commentator calls for a correction of this magnitude while the asset is trading significantly higher, the projection is frequently dismissed as fear-mongering or extreme bearish bias. However, the dynamic shifts fundamentally once the price action begins descending toward the top of that anticipated range.
Market technicians emphasize that entering a target zone does not inherently validate the entire overarching prediction, but it does force market participants to pay closer attention to how the asset behaves at these historical inflection points. The upper boundary of the $65,000–$55,000 corridor acts as an immediate psychological and structural test for the broader bull market narrative.

If Bitcoin manages to find foundational support around the upper limits of this zone, the second phase of the historic roadmap—an extended accumulation phase—comes into play. For this scenario to unfold constructively, market data would need to reflect a cessation of lower lows, a narrowing of the daily trading range, and clear on-chain indicators suggesting that aggressive sellers are exhausting their inventory while buyers step in to defend key structural levels.
Conversely, failure to hold the upper echelon of this designated zone introduces substantial downside risk. Should the $65,000 threshold break decisively under heavy selling volume, traders will inevitably look toward the lower boundary near $55,000 as the next major liquidity pocket. In technical analysis, liquidity zones often act as magnets for price action where stop-losses are clustered and institutional accumulation may occur, making the lower end of Klarck’s predicted range a critical line in the sand for midterm market structure.
The Dangers and Utilities of Relying on Historical Forecasts
The resurgence of the Klarck roadmap underscores a recurring phenomenon in financial markets: the tendency to retroactively validate predictions once a single variable aligns with reality. Financial psychologists and veteran traders frequently caution against assigning undue weight to old forecasts, emphasizing that market dynamics are inherently fluid and subject to continuous evolution.
Macroeconomic conditions shift rapidly. Central bank monetary policies, global liquidity flows, regulatory crackdowns, geopolitical tensions, and institutional capital inflows via spot exchange-traded funds (ETFs) create an environment that is vastly different today than it was when the roadmap was originally drafted in February. A forecast that appears accurate for a brief window can just as easily break down entirely if macro catalysts suddenly alter the trajectory of risk assets.
Consequently, financial experts advocate for utilizing historical roadmaps and archived analyst posts strictly as reference points rather than deterministic trading plans. An old chart can be instrumental in framing the specific technical levels, support barriers, and resistance bands that the broader market is currently testing. However, it must always be cross-referenced and validated by real-time price action, order book depth, and current derivative market metrics.
Market Implications and Broader Industry Perspective
The re-emergence of this technical projection highlights the anxiety and anticipation currently gripping the cryptocurrency landscape. As Bitcoin navigates a complex macroeconomic environment characterized by fluctuating interest rate expectations and shifting institutional demand, market participants are starved for navigational tools.
When prominent price levels coincide with historical predictions, it creates a self-fulfilling prophecy to a degree, as thousands of retail and institutional traders simultaneously monitor the exact same support and resistance zones. This collective attention can amplify volatility as orders cluster around the anticipated accumulation corridors.
Ultimately, whether the remainder of Klarck’s roadmap plays out—culminating in the ambitious $140,000 target—remains an open and heavily debated question. For now, the immediate utility of the analysis lies in its framing of the ongoing correction. As Bitcoin tests the durability of the $65,000–$55,000 zone, the market is once again reminded that while history may not repeat itself identically, technical structures and psychological price thresholds often echo past market cycles in striking ways. Traders and investors are advised to maintain robust risk management strategies, relying on confirmed market signals rather than nostalgic adherence to past commentary as the digital asset sector charts its next major directional move.