The landscape of the digital asset market has shifted dramatically, moving away from the palpable euphoria that characterized earlier periods toward a state of heightened caution and strategic positioning. Bitcoin, the world’s leading cryptocurrency by market capitalization, has officially transitioned into a well-documented Dollar-Cost Averaging (DCA) zone. This specific structural region has historically emerged during market cycles when prevailing sentiment plummeted to pessimistic lows, quietly laying the groundwork for substantial long-term gains. While short-term volatility and bearish pressures continue to weigh on trader confidence, market analysts point to recurring cyclical patterns that suggest this phase could represent a pivotal accumulation window for institutional and retail investors alike.
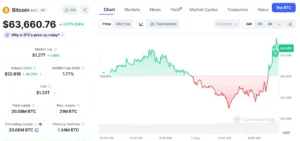
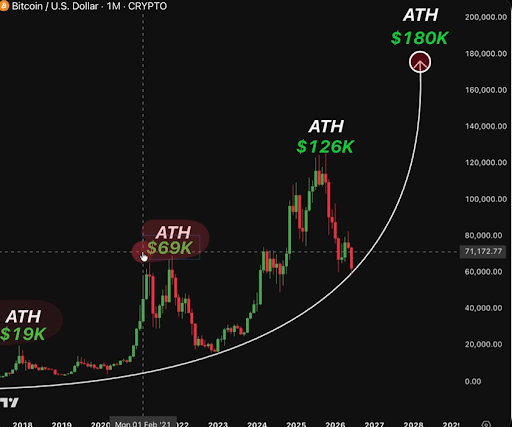
The recent evolution of Bitcoin’s price action highlights a departure from the bullish milestones achieved in late 2025, when the asset reached an all-time high above $126,000 following a massive rally from the lows of the 2022 FTX-induced collapse. Currently changing hands around the $62,800 threshold, Bitcoin is testing crucial long-term curved support levels on monthly timeframes. This positioning has drawn intense scrutiny from market observers, who are actively evaluating whether the current environment mirrors the structural setups of past multi-year cycles or if deeper macro headwinds will force a more prolonged consolidation period.
Historical Parallels: Examining the 2019 and 2022 Accumulation Phases
To understand the significance of Bitcoin’s current price behavior, market historians frequently look back at structural analogues from previous halving cycles. The overarching narrative of the cryptocurrency market has routinely followed a predictable emotional arc: extreme highs are followed by systemic disbelief, widespread declarations that the asset is "dead," and the eventual formation of a deep DCA accumulation channel that precedes the next parabolic breakout.

In 2019, Bitcoin experienced a profound cooling-off period following its late-2017 peak of approximately $19,000. That cycle saw the asset endure an 83% drawdown, plunging deep into a depressed accumulation range where market participation dwindled and retail interest faded. Despite the bleak macro outlook at the time, that exact DCA zone formed the foundation for the subsequent bull run that culminated in the 2021 all-time high of roughly $69,000.
A structurally identical, albeit compressed, timeline unfolded in the wake of the November 2022 FTX exchange collapse. Forced liquidations and cascading counterparty failures dragged Bitcoin down to a cycle low of approximately $15,500. Yet, steadfast market participants who utilized the lower pricing tiers to accumulate assets were rewarded with a nearly 600% rally. This upward trajectory breached the $100,000 psychological milestone and eventually drove BTC to fresh record highs above $126,000 in October 2025.
Crypto analyst Ardizor recently highlighted these historical similarities in a widely discussed post on X (formerly Twitter), noting that current market conditions bear an uncanny resemblance to the pre-recovery phases of past cycles. The recurrence of this pattern suggests that market psychology remains remarkably consistent, driven by alternating waves of speculative mania and debilitating fear.
Current Market Dynamics and On-Chain Realities
Despite the encouraging historical context provided by long-term monthly charts, the immediate market environment presents a complex mixture of bullish accumulation and persistent bearish headwinds. Bitcoin is currently trading near $62,800, successfully respecting the long-term curved support line that underpins the bull thesis. However, the path forward is complicated by shifting liquidity dynamics, institutional exchange-traded fund (ETF) flows, and underlying on-chain metrics.

Recent data indicates that capital is selectively flowing out of the network, tempering the aggressive buying momentum observed earlier in the cycle. Specifically, Bitcoin’s Realized Cap—a metric that values each unspent transaction output (UTXO) at the price it last moved on-chain—has experienced a decline of roughly $12 billion from its peak in mid-May. This contraction reflects a reduction in aggregate capital stored within the network, signaling that profit-taking and capital flight have outpaced fresh inflows in the short term.
Furthermore, evaluations of Bitcoin’s Profit and Loss (PnL) Index suggest that the asset has not yet definitively signaled an absolute cycle bottom. Instead, quantitative market models position BTC within a transitional phase. Analysts note that while the market may experience additional downside or prolonged sideways chop before establishing a final structural floor, this intermediate uncertainty does not invalidate the DCA thesis. In fact, historical analysis shows that the 2019 and 2022 accumulation zones rarely materialized under calm, bullish conditions; rather, they formed precisely when market liquidity was thin, macroeconomic fears were elevated, and the broader trading community anticipated a deeper correction.
Institutional Perspectives and Macroeconomic Influences
The interplay between institutional participation and macroeconomic policy continues to dictate the broader trajectory of the digital asset sector. Coinbase executives and various institutional market makers have repeatedly characterized prolonged market downturns and lower price tiers as a structural "discount" window for sovereign wealth funds, corporate treasuries, and institutional allocators. As traditional financial institutions increasingly integrate digital assets into diversified portfolios through spot ETFs and regulated custody solutions, the nature of market cycles has begun to evolve.
While retail sentiment often oscillates violently between extreme greed and capitulation-driven fear, institutional entities frequently approach multi-year cycles with a long-term horizon, favoring disciplined, systematic accumulation strategies like Dollar-Cost Averaging. This divergence in market behavior helps explain why Bitcoin can simultaneously experience institutional accumulation while suffering from retail-driven sell pressure and negative ETF net flows on a week-to-week basis.
Macroeconomic factors, including central bank monetary policies, global liquidity indices, and shifting regulatory frameworks across major economies, further complicate the outlook. As inflationary pressures and shifting interest rate expectations influence global risk assets, Bitcoin occupies a unique dual role as both a high-beta growth asset and an emerging decentralized monetary network. The resilience of the asset’s long-term support structure amidst these shifting macroeconomic currents will likely determine whether the current consolidation phase resolves into a sustained upward trend or a prolonged period of range-bound trading.
Implications for Market Participants
The transition of Bitcoin into a historical DCA zone carries distinct implications for different classes of market participants. For short-term leveraged traders, the prevailing transition phase and lack of immediate upside euphoria introduce heightened volatility risks, requiring strict risk management and capital preservation strategies. The decline in Realized Cap and the transitional readings of the PnL Index serve as empirical reminders that downside risks remain present, and a definitive bottoming signal has yet to be fully printed across all on-chain metrics.
Conversely, for long-term investors adhering to systematic investment strategies, the current price region offers structural parallels to previous accumulation zones that ultimately preceded historic bull markets. By focusing on multi-year timeframes rather than day-to-day market noise, these participants view the prevailing fear and market apathy as necessary components of a healthy market cycle reset.
As Bitcoin continues to test its crucial curved support level around the low-$60,000 range, the coming weeks and months will test the resolve of the market. Whether the current environment serves as the launching pad for the next major leg of the secular bull market or requires an extended consolidation phase remains to be seen. What is clear, however, is that the fundamental dynamics governing Bitcoin’s multi-year market cycles continue to operate with remarkable consistency, rewarding patience, discipline, and data-driven perspective over emotional reaction.