The cryptocurrency market is experiencing a profound psychological shift as Bitcoin’s price action departs from the exuberant heights of previous rallies, retreating into a familiar historical territory known as the Dollar-Cost Averaging (DCA) accumulation zone. This price region, characterized by widespread market pessimism and waning retail participation, has historically served as the quiet foundation for major multi-year recoveries. Trading around the $62,800 threshold, the world’s leading digital asset is testing the resilience of long-term investors while macro headwinds and shifting capital flows challenge the immediate bullish thesis.
Market observers and on-chain analysts have increasingly pointed to recurring structural patterns on the monthly timeframe. These patterns suggest that the current macroeconomic and technical environment closely mirrors the depressed accumulation phases of 2019 and late 2022. While short-term volatility and institutional outflow pressures weigh heavily on sentiment, historical analogs indicate that periods of intense market fear and thin liquidity frequently precede significant cyclical breakouts.
The Historical Context: Cycles of Despair and Accumulation
To understand Bitcoin’s current positioning, financial analysts often examine its long-term cyclical behavior. The cryptocurrency market operates on roughly four-year cycles, typically dictated by the network’s halving schedule, which reduces the issuance rate of new coins by half. However, price performance is heavily dictated by macroeconomic liquidity, regulatory developments, and shifts in investor psychology.

In 2019, following a punishing bear market that wiped out more than 83% of Bitcoin’s value from its late 2017 peak near $19,000, the asset entered a prolonged consolidation phase. During this period, mainstream media frequently declared Bitcoin dead, and retail enthusiasm evaporated. Yet, this exact DCA zone formed the springboard for the explosive 2020–2021 bull run, which culminated in an all-time high of approximately $69,000.
A structurally identical scenario unfolded in late 2022. The sudden collapse of the FTX cryptocurrency exchange in November of that year triggered a cascade of forced liquidations and institutional panic, dragging Bitcoin down to a cycle low of roughly $15,500. Once again, market sentiment reached historic lows of capitulation. Patient accumulators who ignored the pervasive fear were rewarded when Bitcoin initiated a powerful recovery, rallying nearly 600% to shatter previous records and surpass the $100,000 milestone, eventually reaching a new peak above $126,000 in October 2025.
Today, the asset’s descent toward the $62,800 mark places it directly on the curved support lines that defined those previous cyclical transition windows. Crypto analyst Ardizor recently highlighted this repeating dynamic on social media, emphasizing that the market routinely transitions from over-leveraged euphoria to deep skepticism just as the groundwork for the next major leg up is being laid.
Current Market Dynamics: ETF Outflows and On-Chain Realities
Despite the compelling historical comparisons, the current macroeconomic and institutional landscape presents unique challenges that distinguish this phase from past cycles. Unlike previous eras dominated primarily by retail traders, the modern Bitcoin market is heavily influenced by institutional capital vehicles, notably spot Bitcoin Exchange-Traded Funds (ETFs), corporate treasury allocations, and macroeconomic monetary policy.

Recent on-chain data illustrates the immediate friction facing the market. Bitcoin’s Realized Cap—a metric that values each UTXO (Unspent Transaction Output) at the price it last moved on-chain, effectively reflecting the total capital realized in the network—has declined by approximately $12 billion from its peak in mid-May. This contraction indicates that capital is actively leaving the network, reflecting profit-taking, risk-off behavior by institutional investors, or liquidations of leveraged positions.
Furthermore, composite health metrics such as the Profit and Loss (PnL) Index suggest that Bitcoin may not have reached an absolute macroeconomic bottom. Analysts point out that the market is currently caught in a complex transition phase. While long-term holders continue to accumulate assets at a steady pace, short-term holders and leveraged traders remain vulnerable to sudden liquidations driven by macroeconomic uncertainty, shifting interest rate expectations, and regulatory scrutiny in major global economies.
However, market historians argue that these bearish indicators do not invalidate the DCA thesis. In fact, past accumulation zones in 2019 and 2022 were likewise defined by negative news cycles, regulatory crackdowns, and macro uncertainty. Capitulation signals and shrinking realized caps are typical hallmarks of a market purging excess leverage before embarking on a sustained organic expansion.
Implications for Long-Term Investors and Institutional Strategies
The divergence between short-term bearish pressures and long-term bullish structural setups highlights a critical decision point for market participants. For institutional funds, corporate allocators, and retail investors utilizing a Dollar-Cost Averaging strategy, the current price range presents a calculated risk-reward proposition.
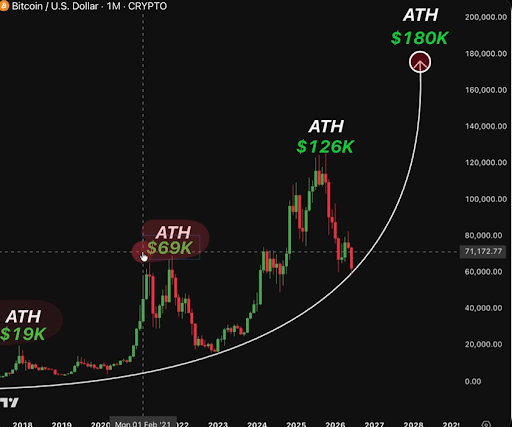
DCA—the practice of regularly purchasing fixed dollar amounts of an asset regardless of price fluctuations—is designed specifically to mitigate the psychological stress of volatility and market timing. By entering the market during periods of low euphoria and high skepticism, investors remove the emotion from asset accumulation. If Bitcoin respects its historical monthly chart support levels, the current price compression could mirror the stealth accumulation phases that historically precede parabolic advances.
Conversely, risk management remains paramount. If macroeconomic conditions deteriorate—such as unexpected tightening by central banks or systemic liquidity crunches—Bitcoin could breach its historical curved support, testing deeper multi-month liquidity pools before establishing a true cyclical floor. Institutional risk desks are closely monitoring ETF net flows, exchange reserves, and derivatives open interest to gauge whether institutional demand will absorb incoming sell pressure.
Broader Outlook and Forward Trajectory
As Bitcoin navigates this critical juncture around $62,800, the overarching narrative remains a test of market endurance. The transition from euphoria to a DCA accumulation zone is rarely comfortable; it requires investors to look past immediate price stagnation and headline-driven fear.
While on-chain metrics and declining realized capitalization demonstrate that the market is still working through systemic distribution and capital outflow, the structural parallels to 2019 and 2022 cannot be easily dismissed. Whether Bitcoin uses this zone as a launching pad for a renewed push toward record highs or undergoes a deeper structural correction will depend heavily on upcoming macroeconomic liquidity shifts and the sustained commitment of long-term capital allocators. For now, the market remains locked in a familiar cycle of transition, where patience and disciplined accumulation continue to define the playbook of seasoned market participants.