
Ethereum finds itself locked in a complex macroeconomic and technical paradox as mounting bearish pressure threatens to push its spot price down toward the $1,500 psychological support level. While token valuations struggle under the weight of broader cryptocurrency market consolidation, fundamental blockchain metrics tell a radically different story. On-chain data indicates that user adoption, transactional throughput, and developer engagement have decoupled from price action, scaling to historic all-time highs. This divergence between bearish price trends and booming network fundamentals has ignited intense debate among market analysts, institutional investors, and retail participants regarding Ethereum’s medium-term trajectory and ultimate market bottom.
The Main Facts: Price Versus On-Chain Reality
At the core of the current market discourse is the stark contrast between Ethereum’s valuation and its utility. Spot prices have experienced persistent downward momentum, repeatedly retesting critical support zones around the $1,600 threshold. Market strategists note that sustained macroeconomic headwinds, cautious institutional risk appetite, and shifting liquidity flows have dampened near-term bullish prospects. Consequently, a breach of current supports opens the door for a potential slide toward $1,500, with some technical models suggesting even deeper retracements under extreme volatility.
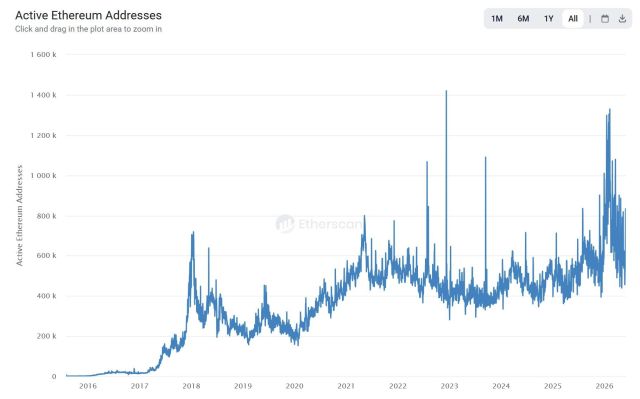
However, a superficial glance at price charts overlooks the unprecedented vitality within the Ethereum execution and consensus layers. Reports compiled by leading blockchain researchers indicate that network activity is operating at peak levels. Daily active addresses, smart contract deployments, and decentralized finance (DeFi) interactions continue to surge. This ongoing utilization solidifies Ethereum’s status as the foundational settlement layer for decentralized applications, institutional tokenization initiatives, and layer-2 scaling solutions. Rather than reflecting a dying ecosystem, the prevailing data illustrates a robust, highly active network navigating a turbulent price cycle.

Chronology of Network Growth: From 2018 to the 2025-2026 Cycle
To fully appreciate the scale of current network adoption, analysts look back at historical usage milestones across previous market cycles. During the 2018 crypto market cycle, daily active wallet addresses on the Ethereum network peaked at approximately 720,000. As the cryptocurrency sector matured and entered the explosive bull market of 2021, that metric expanded, topping out near 800,000 daily active addresses.
In the subsequent years, architectural upgrades, the successful transition to Proof-of-Stake (PoS), and the proliferation of layer-2 rollups dramatically improved network scalability and reduced transaction costs. These structural enhancements paved the way for the usage explosion observed in the 2025-2026 market cycle. Throughout this period, daily active addresses have consistently pushed past the 1 million threshold, occasionally peaking above 1.3 million. This chronological progression reveals a vital reality: the Ethereum network is currently processing significantly higher levels of authentic, organic user activity than it did during the height of the previous multi-billion-dollar bull run.
Supporting Data: Plunging Exchange Reserves and Supply Dynamics
Complementing the surge in daily active addresses is a dramatic contraction of available supply across centralized cryptocurrency exchanges. Market liquidity data highlights a historic exodus of Ether from trading platforms into private wallets, cold storage solutions, and institutional custody.

Historically, during periods of heightened market volatility and downward price pressure, investors rush to deposit assets onto exchanges to facilitate quick liquidations or defensive trades. However, the current cycle has defied this historical precedent. According to on-chain analytics shared by market experts like Leon Waidmann, the total balance of ETH held on centralized exchanges plummeted to approximately 14.5 million coins.
This drop represents a historic low for exchange reserves, occurring not in the wake of a localized market crash, but as a protracted structural trend. To put this into perspective, in October 2023, exchange balances hovered around 21 million ETH. Over the subsequent two and a half years, more than 6 million ETH have been systematically withdrawn from circulating exchange inventory. This aggressive accumulation points toward strong conviction among holders. As Waidmann succinctly observed regarding the persistent outflows, institutional and retail entities acquiring ETH at these levels are showing zero inclination to return those assets to the open market for near-term selling.
Expert Analysis and Official Responses: Identifying the Ultimate Market Bottom
While on-chain metrics point to aggressive long-term accumulation, short-term technical analysts remain vigilant regarding potential downside targets. Prominent crypto analyst Ali Charts recently published an evaluation focusing on Ethereum’s potential macro price bottom, utilizing the Ethereum Delta Price metric.
The Delta Price metric measures the historical relationship between the aggregate cost basis of investors and the actual production costs incurred by network miners and validators. Because this metric effectively highlights deep value accumulation zones, it has successfully mapped out the exact market bottoms for Ethereum during previous multi-year cycles. Following a comprehensive examination of the current chart formations, Ali Charts suggested that Ethereum’s structural price bottom could potentially reside near the $700 level. Should historical patterns repeat under severe macroeconomic stress, the altcoin might experience a temporary, deep retest of this psychological milestone before establishing the groundwork for a sustained, multi-year upward expansion.
Broader Impact and Market Implications
The intersection of record-high network activity, depleted exchange inventories, and looming technical support tests carries profound implications for the broader digital asset economy.
First, the massive divergence between price and adoption suggests that Ethereum’s underlying utility is no longer strictly tethered to speculative retail sentiment. As tokenization of real-world assets (RWAs), decentralized finance protocols, and enterprise-grade blockchain applications continue to anchor their operations to Ethereum, baseline demand for block space remains insulated from purely speculative downturns.
Second, the unprecedented scarcity of liquid supply on exchanges creates a structural supply squeeze. With over 6 million ETH removed from trading venues over a relatively short window, any sudden resurgence in institutional demand or positive macroeconomic catalysts could trigger a sharp upward repricing. When liquid inventory dries up, even modest increases in buy-side volume can generate outsized upward volatility.
Finally, the possibility of a deeper price correction toward historical valuation baselines serves as a reminder of the inherent volatility within digital asset markets. While long-term investors view accumulation zones and declining exchange reserves as generational buying opportunities, short-term traders must navigate the immediate risks associated with macro-driven liquidations and technical resistance levels. Ultimately, Ethereum navigates a transitional phase defined by profound structural strength on-chain coupled with persistent near-term vulnerability on the charts, setting the stage for one of the most critical chapters in the asset’s history.