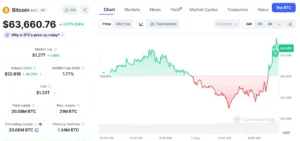
Financial markets have long maintained a fascination with predictive roadmaps, technical projections, and historical price charts. In the fast-paced ecosystem of cryptocurrency trading, where sentiment shifts rapidly between extreme euphoria and intense panic, analysts and retail participants frequently search for historical blueprints to navigate current volatility. Recently, an older Bitcoin market roadmap originally published on social media by prominent crypto commentator Klarck has re-entered public discourse. The renewed attention is not driven by a fresh market signal or an updated analyst forecast, but rather by the simple fact that Bitcoin’s recent price trajectory has moved uncomfortably close to one of the critical downside zones outlined in the months-prior projection.
While the original roadmap contained multiple phases, including a long-term bullish target of $140,000 per Bitcoin, market participants are currently zeroing in on the more immediate, bearish segments of the forecast. As Bitcoin tests crucial macro levels, traders and analysts are evaluating the utility of older technical projections, weighing the psychological comfort of structured roadmaps against the unpredictable nature of live market action. This retrospective look offers valuable insight into how market psychology operates during periods of correction, how historical charts are re-evaluated when price action momentarily aligns with them, and why traders must maintain a healthy skepticism toward static predictions in a dynamic financial ecosystem.
The Genesis of the Roadmap: A Look Back at the February Projections
To understand why Klarck’s roadmap has recaptured the attention of the crypto community, it is necessary to examine the original timeline and context of the post. Published in February on the social media platform X (formerly Twitter), the roadmap laid out a multi-stage trajectory for the world’s leading cryptocurrency by market capitalization. At the time of publication, Bitcoin was navigating a different phase of market sentiment, characterized by shifting macroeconomic pressures and evolving liquidity dynamics.
According to the original post, the roadmap anticipated an initial upward bounce targeting the $83,000 region. This projected relief rally materialized in subsequent weeks, drawing initial praise for the commentator’s short-term precision. However, the roadmap did not project continuous, uninterrupted growth. Following the anticipated bounce to $83,000, the projection called for a gradual, methodical downward correction pulling Bitcoin back into a much deeper value area: the $65,000 to $55,000 price corridor.
Beyond this corrective phase, the roadmap envisioned a prolonged consolidation period—specifically described as a two-week accumulation phase—designed to flush out leveraged long positions and establish a firm market floor. Finally, the historical blueprint projected a structural transition back into a macro bull market, ultimately culminating in an ambitious target of $140,000 per BTC. For months, as Bitcoin fluctuated through various ranges, the middle and later stages of this roadmap remained largely theoretical, pushed to the periphery as newer narratives dominated crypto media headlines.
The Convergence of Price Action and Historical Projections
Financial analysts frequently emphasize that technical analysis is probabilistic rather than deterministic. Roadmaps and Elliott Wave counts, support and resistance lines, and Fibonacci extensions are tools used to frame risk, not crystal balls guaranteed to dictate future outcomes. Therefore, the recent resurgence of Klarck’s February roadmap is notable not because the full prediction has come true, but because price action has systematically navigated toward the upper boundary of the projected downside zone.
As Bitcoin’s recent correction accelerated, pulling the asset down from its local highs, market participants began combing through previously published charts to identify where historical models anticipated support. The $65,000 to $55,000 band, once viewed by skeptics as an overly pessimistic or distant downside target during periods of market exuberance, suddenly transitioned from a hypothetical scenario to an immediate testing ground.
This convergence has triggered a broader debate across trading forums and analytical desks regarding the nature of self-fulfilling prophecies in technical trading. When a prominent analyst outlines a specific path, and the market subsequently follows segments of that path, confirmation bias can easily take hold. Traders begin to treat the remainder of the roadmap as gospel, heightening the risk of poor decision-making. Conversely, seasoned market veterans view the alignment as a mere coincidence of market mechanics—where standard retracement levels naturally overlap with popular analyst projections.
Deconstructing the Critical $65,000 to $55,000 Support Corridor
The focal point of the renewed interest in Klarck’s roadmap is unequivocally the $65,000 to $55,000 price range. In technical analysis, broad support zones are rarely pinpointed to a single exact dollar figure; instead, they represent liquidity clusters and historical areas of high volume where institutional and retail buyers historically step in to defend positions.
When Bitcoin trades significantly higher than a projected correction zone, calls for a drop into the mid-$50,000s often face fierce skepticism from bullish market commentators. However, as prices drift lower and approach the threshold of that zone, the psychological weight of the projection shifts dramatically. Market participants transition from dismissing the downside risk to actively hedging against it.

If Bitcoin stabilizes within this upper $65,000 boundary, the market will enter a phase closely mirroring the second milestone of the historical roadmap: accumulation. For this phase to successfully validate the old forecast, specific market behaviors must emerge. Price action must cease making lower lows, volatility must contract into a tighter consolidation range, and on-chain metrics must reflect decreasing exchange inflows alongside sustained accumulation by long-term holders. These structural shifts would collectively indicate that aggressive sellers are losing control of the order books.
On the other hand, a failure to hold the upper threshold of this critical zone introduces significant structural downside risk. Should the $65,000 floor give way under sustained selling pressure, market technicians warn that the lower boundary of the projected corridor—near the $55,000 mark—will immediately transform into the primary liquidity target for institutional short-sellers and algorithmic trading desks. In such a scenario, the market would likely experience a flush of leveraged long positions, testing the psychological resolve of retail investors who entered the market during earlier phases of the cycle.
The Inherent Dangers of Relying on Outdated Forecasts
While using historical roadmaps can provide a helpful structural framework for analyzing current market tests, financial experts and risk management professionals consistently issue warnings regarding the dangers of treating old forecasts as active trading plans. The cryptocurrency market is among the most fluid and rapidly evolving financial arenas in the world, subject to sudden shocks that can invalidate even the most sophisticated technical projections overnight.
Macroeconomic conditions—including shifts in central bank monetary policies, global liquidity cycles, regulatory announcements, and geopolitical tensions—can fundamentally alter the trajectory of risk assets within a matter of days. A technical roadmap published in February is formulated based on the liquidity conditions, sentiment metrics, and order book structures present at that specific point in time. As months pass, these foundational variables change. Liquidity migrates, open interest in derivatives markets fluctuates, and institutional participation patterns evolve.
Consequently, relying blindly on an aging forecast exposes traders to severe financial risk. When a market participant anchors their trading strategy to an outdated price target, they often ignore real-time invalidation signals flashing on their charts. Professional risk management dictates that current price action must always take precedence over historical projections. Roadmaps should serve merely as reference points to contextualize ongoing market behavior rather than serving as deterministic instructions for executing trades.
Broader Market Implications and Current Sentiment
The market’s current fascination with Klarck’s February roadmap highlights a broader psychological phenomenon inherent in cryptocurrency trading: the search for narrative order amidst chaotic volatility. Markets abhor a vacuum, and when prices correct sharply without an immediately obvious macroeconomic catalyst, participants naturally look to technical analysts, historical charts, and social media commentators to make sense of the movement.
This retrospective validation of technical roadmaps also underscores the democratization of financial analysis. In traditional finance, proprietary models and macro forecasts remain tightly guarded secrets within institutional trading floors. In the crypto industry, however, complex roadmaps are debated openly in real-time on public platforms, allowing retail traders to test ideas against actual market performance on a daily basis.
However, this transparency comes with a distinct downside. The amplification of bearish projections can easily trigger panic-driven selling, exacerbating downward pressure as fearful retail investors rush to exit positions ahead of projected support levels. Conversely, clinging desperately to long-term bullish targets—such as the $140,000 figure embedded in the latter stages of Klarck’s roadmap—can blind investors to immediate structural vulnerabilities, encouraging them to "buy the dip" prematurely in a macro environment that demands caution.
Conclusion: Balancing Historical Insight with Real-Time Discipline
As Bitcoin continues to test the upper parameters of the $65,000 to $55,000 downside zone outlined months ago, the crypto community is reminded of both the utility and the limitations of technical analysis. Klarck’s February roadmap has successfully re-entered the spotlight because the market’s physical movement has brought it back into alignment with a previously mapped-out scenario.
Yet, whether the remainder of the projection—including the anticipated accumulation phase and the eventual push toward six-figure valuations—will play out remains an entirely open question. Markets are defined by their capacity to surprise, and history rarely repeats itself with absolute mechanical precision.
For traders, analysts, and long-term investors alike, the resurgence of this roadmap serves as a timely lesson in disciplined observation. Historical roadmaps can be exceptionally useful for framing discussions around key support and resistance levels, but they must always be contextualized by live price action, volume profiles, and macroeconomic realities. As Bitcoin navigates this critical structural juncture, the wisest course of action involves maintaining rigorous risk management protocols, respecting invalidation levels, and avoiding the trap of treating historical speculation as financial certainty.