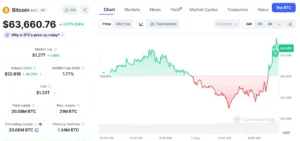
The cryptocurrency market is once again scrutinizing an archival price projection originally published by market commentator Klarck, as Bitcoin’s recent downward trajectory brings it uncomfortably close to a crucial downside threshold mapped out months in advance. While aged technical projections are frequently dismissed as hindsight bias or confirmation bias by veteran market participants, the uncanny alignment between historical charting and current price action has reignited debate across social media and trading desks alike.
Rather than serving as a fresh trading signal, the re-emergence of this February roadmap offers a compelling case study in market psychology, technical analysis longevity, and how traders dynamically reassess past price blueprints when macroeconomic volatility forces assets back toward historical support zones. As Bitcoin navigates a challenging market environment, dissecting the anatomy of this roadmap provides essential context for understanding current investor sentiment and market mechanics.
The Genesis of the Roadmap: From Optimism to Correction
The timeline of the projection in question dates back to earlier this year, when crypto commentator Klarck shared a comprehensive multi-stage Bitcoin roadmap on the social media platform X. At the time of publication, the digital asset market was exhibiting distinct behavioral patterns that informed the analyst’s multi-step thesis.
According to the original post, the roadmap outlined a precise sequence of market movements: an initial bullish relief bounce carrying Bitcoin toward the $83,000 threshold, followed by a controlled, gradual retracement into a deeper correction zone spanning between $65,000 and $55,000. Following this anticipated pullback, the roadmap predicted a mandatory two-week accumulation phase designed to wash out leveraged long positions and stabilize order books. Finally, the long-term trajectory pointed toward a dramatic macroeconomic expansion phase, ultimately targeting an ambitious $140,000 per Bitcoin cycle peak.
For months, as the market fluctuated through various sideways channels and localized rallies, the roadmap largely faded from mainstream industry discourse. However, as broader macroeconomic pressures, shifting liquidity dynamics, and profit-taking activity weighed heavily on the world’s largest cryptocurrency, spot prices steadily eroded. This downward drift eventually steered Bitcoin back toward the upper boundaries of the exact corrective region anticipated in the February forecast, breathing new life into the archival post and prompting traders to pull up the months-old charts for a second look.
Decoding the $65,000 to $55,000 Support Band
Market analysts and technical traders generally agree that the most critical component of Klarck’s resurrected roadmap is not the lofty $140,000 ultimate target, but rather the immediate support corridor resting between $65,000 and $55,000.
When long-term projections call for deep corrections while an asset is trading substantially higher, such predictions are frequently met with skepticism or outright derision. However, as spot prices compress and edge closer to the upper limits of forecasted downside parameters, the psychological weight of those zones shifts dramatically.
Financial markets operate heavily on collective psychology and historical liquidity pools. The $65,000 threshold has historically functioned as a psychological line in the sand for institutional allocators and retail participants alike. A descent into this territory forces market participants to evaluate whether the correction is merely a healthy mid-cycle consolidation or the precursor to a more severe macro downtrend.
Should Bitcoin successfully stabilize within this broader $65,000–$55,000 band, the market will likely transition into the accumulation phase outlined in the roadmap. For this phase to materialize in reality, technical indicators must demonstrate a cessation of lower lows, a contraction in volatility bands, and tangible evidence that aggressive institutional and retail sellers are exhausting their inventory. Conversely, a failure to defend the upper boundaries of this critical zone could invalidate the roadmap’s mid-term assumptions, potentially opening the door for a deeper flush toward the $55,000 floor where dense pockets of market liquidity traditionally reside.

The Pitfalls of Relying on Historical Forecasts
While technical analysis provides a structured framework for anticipating market behavior, seasoned financial journalists and quantitative researchers consistently emphasize the inherent dangers of treating outdated market forecasts as infallible trading playbooks.
Financial markets are inherently dynamic, fluid ecosystems influenced by a constantly shifting matrix of macroeconomic variables. Central bank monetary policies, unexpected regulatory crackdowns, geopolitical tensions, shifts in global exchange-traded fund (ETF) inflows, and sudden changes in derivatives market leverage can entirely invalidate technical roadmaps constructed months prior. A forecast that appeared structurally sound in February may completely break down under the weight of entirely new macroeconomic realities months later.
Consequently, professional traders and risk managers approach resurfaced roadmaps with extreme caution. Rather than using an old forecast as an automated execution plan, experienced market participants view such materials strictly as historical reference points. They serve to highlight psychological price levels and historical congestion areas that the market is currently testing, but they must always be cross-referenced and confirmed by real-time order book data, volume profiles, and live price action.
Broader Market Implications and Macroeconomic Context
The renewed attention given to Klarck’s roadmap coincides with a delicate transitional period for the broader digital asset ecosystem. As institutional adoption matures through spot Bitcoin exchange-traded funds and corporate treasury allocations, the structural behavior of Bitcoin cycles has begun to evolve.
Historically, Bitcoin price cycles were heavily driven by retail euphoria and four-year halving milestones. In the current market cycle, however, macroeconomics plays an exponentially larger role. Global liquidity cycles, United States Federal Reserve interest rate decisions, Treasury yield fluctuations, and foreign exchange market movements exert profound influence over risk-on assets, including cryptocurrencies.
When a digital asset experiences a retracement toward multi-month lows, the entire crypto economy reacts. Miners face margin compression, leveraged derivatives traders face cascade liquidations, and spot holders evaluate their time horizons. In this environment, technical roadmaps—whether accurate by design or simply coincidentally aligned—act as focal points for market sentiment. They provide a narrative structure that helps investors make sense of erratic price movements and emotional market swings.
Looking Ahead: What Traders Are Monitoring Next
As Bitcoin continues to test the waters of the lower technical regions outlined in early-year forecasts, market participants remain divided on the immediate path forward.
On one hand, proponents of the structural bull market argue that healthy corrections are a necessary component of sustainable long-term growth, flushing out speculative excess and resetting funding rates across major derivatives exchanges. On the other hand, cautious observers warn that macroeconomic headwinds could prolong the consolidation phase, testing the psychological resolve of long-term holders.
Whether the remainder of Klarck’s roadmap—specifically the projected recovery, accumulation, and eventual ascent toward $140,000—will successfully materialize remains an open and heavily debated question. What is certain, however, is that the market’s current rendezvous with these previously charted downside zones underscores the enduring fascination with technical analysis and the eternal human desire to find order within the chaotic price discovery of decentralized financial markets.