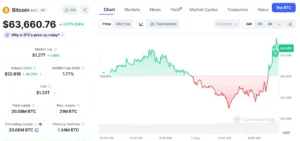
An older Bitcoin roadmap, originally shared by the influential crypto commentator Klarck in February, is currently undergoing significant re-evaluation within the digital asset community as Bitcoin’s price action has converged closely with one of the key downside zones he meticulously outlined months ago. This resurfacing of a prior projection underscores the analytical frameworks employed by traders and analysts to contextualize current market movements against historical forecasts, offering a blend of validation and cautionary lessons.
In February, a period characterized by heightened optimism and a burgeoning bull market sentiment, Klarck, a prominent voice on social media platform X (formerly Twitter), published a comprehensive Bitcoin roadmap. His analysis projected an initial ascent towards an $83,000 price point, followed by a gradual but distinct decline into a $65,000 to $55,000 region. This anticipated downturn was then expected to give way to a two-week accumulation phase, setting the stage for a subsequent transition back into growth, ultimately culminating in a projected price target of $140,000 per BTC. At the time of its initial release, this forecast, particularly its bearish interlude, stood in contrast to some of the more overtly bullish narratives dominating the market, which were largely fueled by the approval of spot Bitcoin Exchange-Traded Funds (ETFs) and the impending Bitcoin halving event.
The significance of Klarck’s roadmap today stems not from its novelty as a fresh market signal, but from its prescient identification of a critical price range that Bitcoin has now entered. While the market did not precisely reach Klarck’s $83,000 target before its recent downturn, it did experience substantial rallies, hitting new all-time highs above $73,000 in March. This initial upward trajectory lent some credence to the first phase of his prediction. However, it is the subsequent price correction and Bitcoin’s current proximity to the $65,000-$55,000 zone that has thrust this February forecast back into the spotlight, compelling traders and analysts to revisit its potential implications.
The Genesis of Klarck’s Forecast and February Market Dynamics
To fully appreciate the renewed relevance of Klarck’s roadmap, it is crucial to recall the market environment in which it was first presented. February 2024 was a period of intense bullish momentum for Bitcoin. Following the landmark approval of spot Bitcoin ETFs by the U.S. Securities and Exchange Commission (SEC) in January, significant institutional capital began flowing into the cryptocurrency market. This influx, coupled with the anticipation surrounding the quadrennial Bitcoin halving event slated for April, fueled a powerful rally. Bitcoin’s price was rapidly ascending, breaking through key resistance levels and exhibiting robust demand.
During this period, many analysts and market participants were forecasting parabolic moves and quick surges to unprecedented highs. Klarck’s roadmap, while projecting significant long-term upside to $140,000, also embedded a notable cautionary phase – the gradual drop to $65,000-$55,000. This call for a substantial correction, even if temporary, might have seemed counter-intuitive to some amidst the prevailing euphoria. However, seasoned analysts often incorporate such corrective phases into their long-term outlooks, recognizing the cyclical nature of bull markets and the necessity of price discovery and consolidation. Klarck’s foresight in identifying a potential downside zone months in advance highlights a disciplined approach to technical analysis, looking beyond immediate trends to outline a more comprehensive market trajectory.
Bitcoin’s Journey to the Critical Zone: A Chronology of Price Action
- February 2024: Klarck publishes his roadmap. Bitcoin is in a strong uptrend, fueled by ETF inflows and halving anticipation, breaking above $50,000 and pushing towards $60,000. The market’s sentiment is overwhelmingly positive.
- March 2024: Bitcoin continues its meteoric rise, achieving a new all-time high of over $73,000. This validates the initial upward leg of Klarck’s prediction, albeit slightly short of the $83,000 target. The market experiences some volatility but largely holds strong.
- April 2024: The Bitcoin halving occurs. In the lead-up and immediate aftermath, Bitcoin experiences a significant correction from its March highs, dipping below $60,000. This marks the beginning of the "gradual drop" phase outlined by Klarck. Macroeconomic concerns, particularly persistent inflation and the "higher for longer" interest rate narrative from the Federal Reserve, begin to weigh on risk assets.
- May-June 2024: Bitcoin consolidates around the lower $60,000s, attempting to reclaim higher levels but facing consistent selling pressure. Recent price action has seen Bitcoin break below key support levels, pushing it directly into the upper boundary of Klarck’s identified $65,000-$55,000 downside zone. This convergence has triggered the renewed interest in his old roadmap, as the market begins to validate its specific price targets.
The $65,000-$55,000 Zone: A Technical and Psychological Battleground
The immediate focus for traders and investors is not the ambitious $140,000 long-term target, but rather the integrity of the $65,000-$55,000 support zone. This range is not merely an arbitrary set of numbers; it often represents a confluence of significant technical indicators and psychological thresholds. From a technical perspective, this zone could align with crucial Fibonacci retracement levels from the previous bull run or the recent all-time high, historical support/resistance flip zones, or the 200-day moving average, which often acts as a key indicator of market health.
Scenario 1: Stabilization and Accumulation
If Bitcoin manages to stabilize within this region, it would lend further credibility to Klarck’s roadmap. Stabilization would typically manifest as a reduction in selling pressure, a decrease in price volatility, and the formation of higher lows within a tighter trading range. An "accumulation phase," as described in the roadmap, would involve sideways price action, where institutional and large-scale investors (whales) strategically accumulate Bitcoin without causing significant upward price movements. This period is characterized by a balance between selling exhaustion and gradual buying interest, often visible through on-chain metrics like increasing accumulation addresses, decreasing exchange reserves, and a shift in supply from short-term speculators to long-term holders.
Scenario 2: Breakdown and Further Downside
Conversely, if Bitcoin fails to hold the upper end of the $65,000-$55,000 zone, particularly if it decisively breaks below $60,000 with conviction and volume, the market’s attention would swiftly shift towards the lower boundary near $55,000. A failure to maintain support within this range could indicate stronger underlying bearish sentiment or a deeper market correction. Below $55,000, subsequent liquidity targets could include the psychological $50,000 level, or even lower, depending on the severity of the selling pressure and broader macroeconomic conditions. Such a breakdown would challenge the bullish long-term outlook and potentially force a reassessment of the entire roadmap.

Broader Market Context and Supporting Data
The current price action is not occurring in a vacuum. Several macroeconomic factors and on-chain metrics are contributing to the market’s current state and influencing Bitcoin’s ability to hold critical support levels.
- Macroeconomic Headwinds: Persistent inflation in major economies, particularly the U.S., has led to central banks maintaining higher interest rates for longer than initially anticipated. This "higher for longer" narrative increases the cost of capital, making riskier assets like cryptocurrencies less attractive compared to traditional safe havens or yield-bearing instruments. The strengthening U.S. Dollar Index (DXY) also typically correlates inversely with Bitcoin’s performance, adding pressure.
- Spot Bitcoin ETFs: While initially a significant catalyst for price appreciation, the inflows into spot Bitcoin ETFs have slowed down considerably, with some days even recording net outflows. This suggests that the initial wave of institutional buying might be tapering off, and sustained demand from this sector is crucial for future upside. The activity of these ETFs provides a clear barometer of institutional sentiment.
- On-Chain Metrics:
- Whale Activity: Monitoring large wallet movements can indicate whether significant holders are accumulating or distributing Bitcoin. Recent data might show a mix, with some whales de-risking while others view the current levels as buying opportunities.
- Exchange Flows: Net inflows to exchanges typically suggest an intent to sell, while net outflows indicate accumulation and a move to self-custody. Sustained outflows at these price levels would be a positive sign for potential stabilization.
- Miner Behavior: Post-halving, miner profitability decreases. Some smaller, less efficient miners might be forced to sell their Bitcoin holdings to cover operational costs, contributing to selling pressure. Observing miner capitulation or accumulation patterns can offer insights into the supply side.
- Long-Term Holders (LTHs) vs. Short-Term Holders (STHs): LTHs tend to accumulate during dips, while STHs are often more prone to panic selling. A shift in supply from STHs to LTHs at these levels would signal a healthy market correction and potential bottoming.
- Derivatives Market: Analysis of open interest, funding rates, and liquidation levels in the futures and options markets can reveal areas of potential volatility and where large liquidations might occur, influencing rapid price movements towards specific levels. High negative funding rates can sometimes signal an oversold market ripe for a short squeeze.
The Perils and Utility of Historical Forecasts
The re-emergence of Klarck’s February roadmap serves as a potent reminder of both the potential utility and inherent dangers of relying on old market forecasts.
Dangers:
Markets are dynamic, complex systems influenced by a myriad of factors that can shift rapidly. Macroeconomic conditions, geopolitical events, regulatory changes, and unforeseen "black swan" events can drastically alter market trajectories, rendering even the most meticulously crafted forecasts obsolete. Blindly adhering to an old prediction, regardless of its initial accuracy, can lead to significant financial losses if it fails to adapt to current realities. Furthermore, a forecast, once widely known, can sometimes become a self-fulfilling prophecy if enough market participants act upon it, but this effect is often temporary and can lead to unstable price action.
Utility:
Despite the risks, historical roadmaps like Klarck’s can serve as valuable reference points and frameworks for analysis. They provide a structural lens through which to view current price action, helping traders contextualize movements against a predefined path. When a part of such a roadmap begins to validate, it encourages deeper inquiry into why that particular scenario is playing out. It prompts questions about underlying market dynamics, technical levels, and the confluence of factors that might be driving the price. This analytical approach, rather than passive acceptance, is crucial for informed decision-making. Traders can use such frameworks to identify critical support and resistance levels, anticipate potential turning points, and validate or invalidate parts of the prediction with real-time price action, volume analysis, and on-chain data.
Official Responses and Broader Implications
While Klarck himself has not issued a fresh statement directly addressing the renewed relevance of his February roadmap, the crypto community on platforms like X has seen a noticeable uptick in discussions surrounding his earlier projection. This highlights how influential commentators can shape market discourse, even retrospectively. However, leading industry experts and seasoned editors, in their review of such content, consistently emphasize the importance of exercising caution.
The broader implications of this situation are multifaceted:
- Market Psychology: If Bitcoin stabilizes within or successfully navigates Klarck’s predicted downside zone, it could instill a renewed sense of confidence among investors, reinforcing the belief in structured analysis and potentially leading to a stronger rebound. Conversely, a failure to hold this zone could trigger panic and a significant re-evaluation of the bull market narrative.
- Trading Strategies: Different trading styles will react uniquely. Short-term traders might look for scalping opportunities around the boundaries of the $65,000-$55,000 range, while swing traders might position themselves for a bounce if accumulation signs emerge. Long-term investors, meanwhile, might view this zone as a strategic accumulation area for dollar-cost averaging.
- Analyst Credibility: The validation of a specific part of Klarck’s roadmap, even months later, contributes to his standing as a perceptive analyst, underscoring the value of thorough technical and market analysis. It also encourages other analysts to publish more comprehensive, multi-stage forecasts rather than just immediate price targets.
In conclusion, Klarck’s February Bitcoin roadmap is back in sharp focus not as a definitive future truth, but as a compelling analytical framework that has seen partial validation. As Bitcoin navigates the critical $65,000-$55,000 zone, the market watches intently to see if the next phases – the accumulation and subsequent growth towards $140,000 – will materialize. This scenario serves as a powerful illustration of how historical technical analyses can re-enter market conversations, guiding expectations and influencing trading strategies, provided they are approached with critical discernment and a continuous assessment of evolving market conditions. The question of whether the remainder of Klarck’s ambitious path will unfold remains an open and highly anticipated one, requiring constant vigilance and a keen understanding of both technical indicators and fundamental drivers.
Editorial Process for bitcoinist is centered on delivering thoroughly researched, accurate, and unbiased content. We uphold strict sourcing standards, and each page undergoes diligent review by our team of top technology experts and seasoned editors. This process ensures the integrity, relevance, and value of our content for our readers.