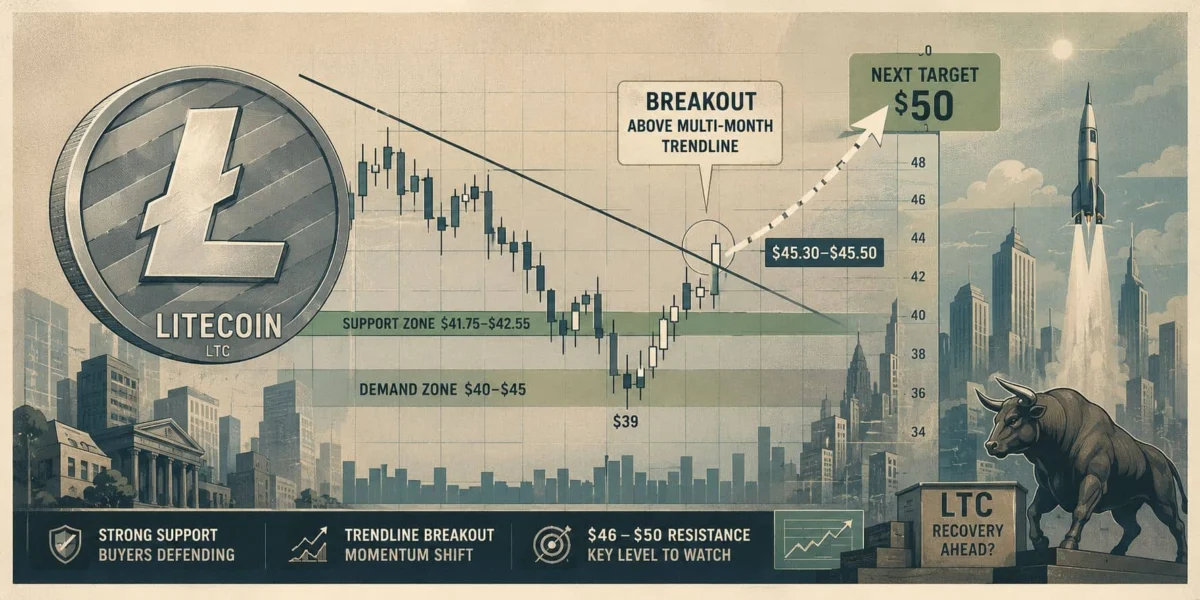
Litecoin (LTC) is demonstrating nascent signs of a technical recovery, having successfully breached a multi-month descending trendline that had previously stifled its price momentum. This significant development has redirected the focus of traders and analysts toward a crucial overhead resistance zone spanning $46 to $50, a level that could determine the sustainability of its current upward trajectory. Despite remaining entrenched in a broader, long-term downtrend, recent price action indicates a discernible easing of selling pressure, with market participants actively defending key support levels. On July 18, the LTC price oscillated around the $45.30-$45.50 mark, registering modest daily gains as the wider cryptocurrency market exhibited a stabilizing trend. The prevailing question among investors now is whether Litecoin can sustain this newfound momentum above its recent breakout point and confirm a more enduring trend reversal, or if it will face renewed rejection at the upcoming resistance.
Litecoin’s Evolving Technical Landscape: A Closer Look
The current technical structure of Litecoin presents a more constructive picture than in previous months. Prominent crypto analyst @LLuciano_BTC highlighted the successful breach of a significant descending trendline on the daily timeframe, a barrier that had consistently capped price advances for an extended period. This breakout is not merely a fleeting upward movement but rather a signal that the bearish pressure, which has dominated LTC for several months, may be waning.
According to the analyst’s shared chart, Litecoin experienced a notable rebound after briefly dipping to approximately $39, demonstrating strong buyer interest at that level. Following this bounce, LTC has entered a consolidation phase within a historically significant demand zone, typically identified between $40 and $45. This zone has acted as a critical support area in the past, suggesting that buyers are stepping in at these levels to prevent further downside. The recent breakout has also drawn attention to the potential formation of a symmetrical triangle structure. Such patterns are closely monitored by technical traders as they often precede significant price movements, signaling either a continuation of the existing trend or a powerful reversal, depending on the direction of the eventual breakout.
The analyst further emphasized that Litecoin is currently navigating an important transition area. The $46-$50 range has emerged as the next substantial resistance zone. For bulls to definitively confirm stronger upside momentum and potentially initiate a broader recovery, they would need to reclaim this zone with conviction, ideally supported by increasing trading volume. Several other market observers have echoed this sentiment, identifying the $42-$50 range as a pivotal trading area for the month of July. They point to improving accumulation signals, suggesting that savvy investors might be acquiring LTC at these levels. However, these observers collectively stress that true confirmation of a bullish shift necessitates sustained daily or weekly closes above the resistance, rather than ephemeral intraday price spikes.

Key Support Holds Firm Amidst Resistance Tests
Adding to the cautiously optimistic outlook, crypto trader @Umairorkz reported that Litecoin has consistently maintained its position above its primary daily support zone, which lies between $41.75 and $42.55. This resilience is notable, especially considering the multiple attempts LTC has made to breach overhead resistance levels. The ability to hold crucial support amidst pressure indicates underlying strength and buyer commitment.
@Umairorkz’s most recent chart analysis pinpoints repeated attempts by LTC to push above the $45.90 mark. Concurrently, an inverse head-and-shoulders pattern appears to be developing on the daily chart. This classical bullish reversal pattern, if confirmed, would typically signal a strong shift from a downtrend to an uptrend. Repeated tests of resistance, even if initially unsuccessful, can gradually erode selling pressure over time as sellers exhaust their positions. However, for a definitive confirmation of such a pattern and a sustained upward move, a decisive breakout supported by a significant surge in trading volume would be required. Without such a volumetric confirmation, the risk of a false breakout remains.
Despite the constructive technical signals, the analyst also introduced a note of caution. A rejection at the current range high, particularly around the $45.90-$46 level, could potentially reverse the nascent bullish momentum, shifting control back to sellers. In such a scenario, the analyst warned, "Failure to reclaim the range high could trigger a breakdown of support toward targets near $35." This downside scenario, however, is presented as conditional. It would likely materialize only if Litecoin were to lose its current, well-defended support structure, making it a technical possibility rather than an immediate probability.
Broader Market Context and Litecoin’s Positioning
Litecoin, often dubbed "the silver to Bitcoin’s gold," was launched in 2011 by Charlie Lee, a former Google engineer. Its design was fundamentally similar to Bitcoin but with key differences intended to make it more suitable for everyday transactions. These included a faster block generation time (2.5 minutes vs. Bitcoin’s 10 minutes), a higher maximum supply (84 million LTC vs. 21 million BTC), and a different hashing algorithm (Scrypt vs. Bitcoin’s SHA-256), which aimed to be more accessible for GPU mining in its early days. These characteristics have historically positioned Litecoin as a faster, lighter alternative for peer-to-peer digital payments.
However, despite its early innovation and consistent development, Litecoin has experienced a prolonged bear market alongside many other altcoins. After reaching an all-time high near $413 in May 2021 during the broader crypto bull run, LTC has seen a significant correction, mirroring the general market downturn that followed. The "long-term downtrend" mentioned in the initial analysis is a reflection of this extended period of depreciation, exacerbated by macroeconomic headwinds, regulatory uncertainties, and a shift in market sentiment away from speculative assets.

Litecoin has also undergone several halving events, the most recent being in August 2023, which reduced the block reward for miners. Historically, halving events are often preceded by price rallies due to anticipated supply shock, although the actual impact can be delayed and influenced by broader market conditions. The current price action could be seen as part of a post-halving accumulation phase, where the market digests the reduced supply over time.
Technical Indicators: A Mixed Bag of Signals
The broader technical picture for Litecoin remains finely balanced, reflecting a market that is not yet decisively bullish but shows clear signs of stabilization. TradingView’s aggregated technical ratings for oscillators currently classify them as "Neutral." This "Neutral" reading is derived from an analysis of widely used indicators such as the Relative Strength Index (RSI-14), Stochastic %K, Commodity Channel Index (CCI-20), ADX-14, MACD, Williams %R, Momentum (10), Bull/Bear Power, and the Ultimate Oscillator. A neutral oscillator reading typically indicates that momentum has stabilized following recent volatility, implying that the asset is neither overbought nor oversold. Consequently, the immediate future price direction is heavily reliant on upcoming breakout or breakdown signals, which would provide a clearer indication of whether buyers or sellers are gaining definitive control.
In contrast, moving averages present a slightly more constructive outlook, particularly on shorter timeframes. Shorter-term Simple Moving Averages (SMAs) and Exponential Moving Averages (EMAs) have begun to generate more buy signals than sell signals across various shorter timeframes. This suggests that the immediate, short-term trend is leaning positive, with prices moving above these short-term averages. However, it is crucial to note that longer-term moving averages continue to reflect the broader correction that has dominated Litecoin throughout the past year. This divergence between shorter-term bullish signals and longer-term bearish ones indicates that while recent stabilization and minor uptrends are encouraging, they have not yet fully reversed the prevailing macro trend. It underscores the need for sustained upward movement and robust volume to confirm a true long-term trend reversal.
Litecoin Price Prediction: Navigating the Critical Junction
From a purely technical perspective, the next decisive movement for Litecoin will likely hinge on its ability to establish firm acceptance above the critical $46-$50 resistance area. This zone is not just a psychological barrier but also a technical confluence of previous support and resistance levels, making it a formidable challenge for bulls.
Community analysis on platforms like TradingView consistently identifies the $39-$42 range as a major demand zone, reinforcing the notion that this area acts as a strong buying interest point. Meanwhile, the $44-$46 range is considered the immediate "decision area," where current price action is testing resolve. A successful and sustained breakout above the $46-$50 resistance, particularly if accompanied by a significant surge in buying volume, could pave the way for higher recovery targets. Potential upside objectives are frequently cited around the $50-$60 range, representing a return to levels not seen consistently in several months.

Conversely, a failure to hold above the current support structure, especially if LTC falls back below the $40-$42 demand zone, could place renewed focus on lower support levels. This downside scenario would become particularly pertinent if broader cryptocurrency market sentiment were to weaken, potentially dragging altcoins like Litecoin lower. In such an event, the previously mentioned target near $35 would become a significant level to watch.
Currently, Litecoin trades well below its historical peak near $413, highlighting the extensive journey required for a full recovery. The network presently has approximately 77.4 million LTC in circulation out of its maximum supply of 84 million, resulting in a market capitalization of roughly $3.5 billion at the time of this writing. This market cap places it among the top cryptocurrencies, maintaining its relevance in the broader digital asset ecosystem.
In conclusion, Litecoin price prediction models currently lean towards cautious optimism rather than outright bullishness. The recent breakout above the multi-month descending trendline represents a significant improvement in the short-term technical structure. However, market participants are keenly awaiting a confirmed move above the $46-$50 resistance zone, ideally supported by robust trading volume, before concluding that a broader, more sustainable recovery is unequivocally underway. The coming days and weeks will be crucial in determining whether Litecoin can capitalize on its newfound momentum or if it will retreat, reinforcing the long-term downtrend.