
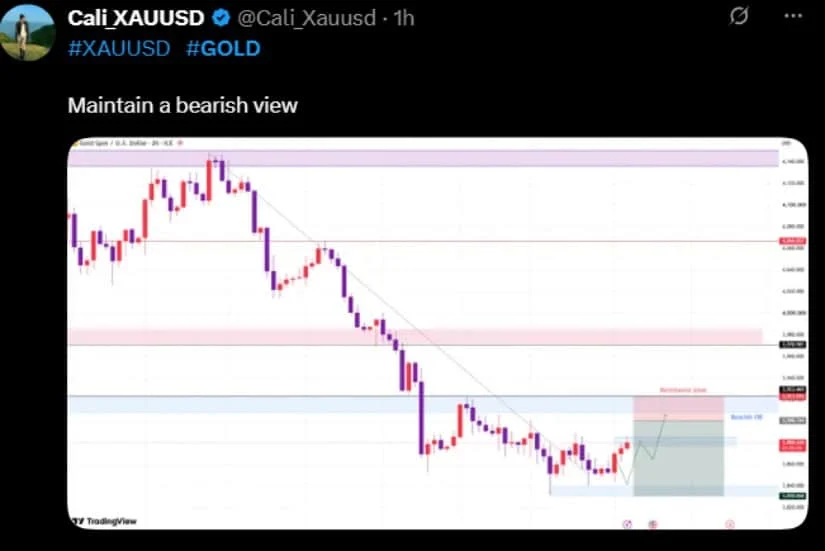
As markets head toward the weekend, gold finds itself at a pivotal crossroads, pulled in opposite directions by persistent near-term selling pressure and the glimmer of a medium-to-long-term recovery signal. After scaling impressive heights earlier in the year, the precious metal has experienced a notable retracement, forcing traders and institutional investors to closely monitor technical indicators, volume shifts, and macroeconomic undercurrents. While the immediate outlook points to a struggle for survival near vital support levels, long-term projections suggest that the current consolidation phase may merely be a stepping stone toward a more robust bullish cycle extending deep into 2027.
Current Market Dynamics and Price Action
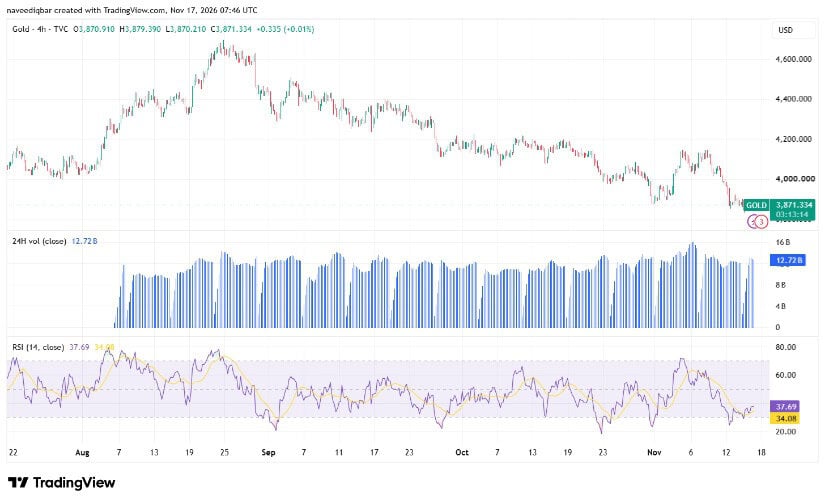
Trading near the $3,875 per ounce mark, gold has surrendered a substantial portion of the ground it gained during a brief November rally that pushed prices briefly above $4,100. Opening the recent trading session at $3,870.91, the metal registered a modest 0.13% tick upward on the latest four-hour candle, yet the overarching structural narrative remains decidedly bearish. This downward trajectory represents a sharp cooling off from the multi-year highs achieved in August, when gold surged to approximately $4,680 per ounce amid intense safe-haven demand and macroeconomic uncertainty.
Throughout September and October, the market formed a series of lower highs, reflecting a systematic reduction in aggressive buying pressure. An early November recovery attempt saw prices climb back toward the $4,120 threshold, but this rally lacked the necessary follow-through volume to sustain momentum. The subsequent rejection drove prices downward once again, testing the $3,875 support zone and leaving the market hovering perilously close to its recent monthly lows.

Despite the persistent downward pressure, volume metrics suggest that the pace of liquidation may be slowing. Over the 24-hour monitoring window, trading volume remained active at approximately $12.74 billion, indicating that institutional and retail participants are intensely engaged at these lower valuations. Whether this activity represents capitulation by late-stage bulls or accumulation by patient value buyers remains the central question for market participants as weekly closes approach.
Technical Indicators Point to Easing Momentum
A closer examination of the technical landscape reveals nuanced signals regarding market momentum. The Relative Strength Index (RSI) on the four-hour timeframe sits at 39.13, accompanied by a signal moving average of 34.18. Both figures reside comfortably below the neutral 50 threshold, confirming that bearish forces retain overall control of the short-term trend.
However, the behavior of the RSI warrants careful observation. Having recently scraped the bottom of its recent trading range, the indicator has begun a slight upward curl. In technical analysis, this divergence often signals that momentum selling is beginning to exhaust itself. While an easing of downward momentum does not automatically translate into an immediate bullish reversal, it frequently precedes a period of consolidation or a technical relief rally as sellers step back and allow the order book to rebalance.
For a sustainable recovery to materialize, bulls must successfully defend the current $3,875 floor over the remainder of the week. A failure to hold these vital technical boundaries could invite a new wave of algorithmic selling, potentially dragging the metal toward deeper liquidity pools and testing lower historical support zones. Conversely, defending this ground could provide the base required for a corrective push back toward overhead resistance.
Short-Term Bearish Outlook and Resistance Barriers
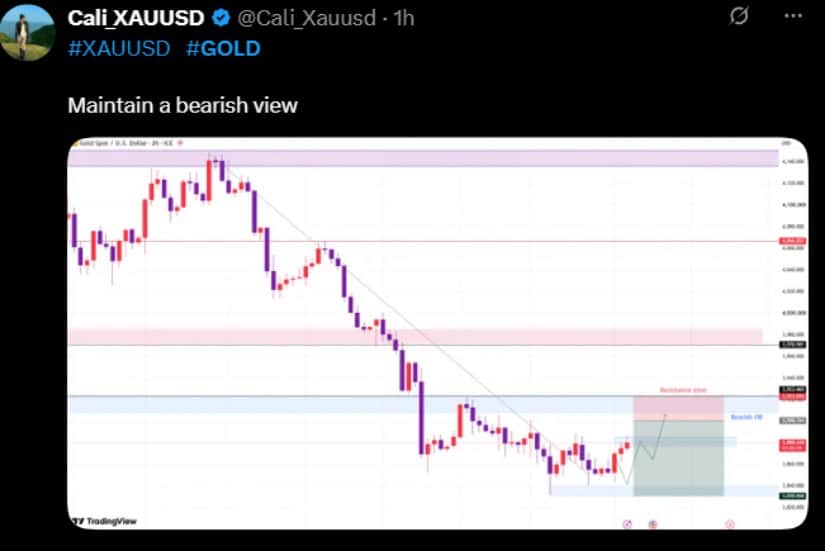
Market analysts specializing in near-term XAU/USD price action maintain a cautious, if not strictly bearish, perspective heading into the weekend. Prominent chart analysts note that a well-defined descending trendline continues to cap price recoveries on the four-hour timeframe. This downward-sloping boundary connects the successive lower highs established since the August peak, serving as a formidable ceiling for any attempted relief rallies.
According to technical reviews shared by market strategist Cali XAUUSD, any near-term bounce is currently viewed as a corrective retest of overhead resistance rather than an outright trend reversal. For the broader market structure to shift back in favor of the bulls, gold must decisively clear this descending resistance line and break out of the established lower-high channel. Until such a structural break occurs, rallies are statistically likely to attract fresh selling interest, keeping the metal locked within its broader corrective phase.
Long-Term Macro Projections to 2027
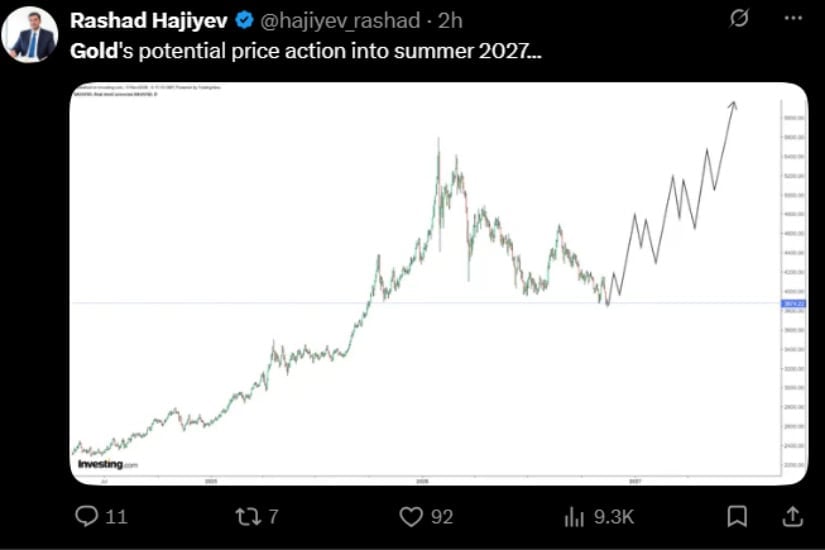
While short-term technical analysts grapple with immediate support and resistance levels, long-term market strategists are painting a substantially more optimistic picture for the years ahead. Prominent commodity and asset forecaster Rashad Hajiev has outlined a bullish multi-year trajectory that envisions gold staging a major structural recovery extending through the summer of 2027.
This long-term thesis is built upon the premise that the metal’s historic advance earlier in the year established a new macro valuation baseline. Rather than moving in a straight, uninterrupted line upward, the projected path incorporates prolonged periods of consolidation and intermittent pullbacks designed to shake out speculative leverage. According to this longer-horizon outlook, gold is expected to carve out a series of higher highs and higher lows over the next twenty-four to thirty-six months, eventually transcending current resistance barriers as macroeconomic tailwinds—including persistent sovereign debt expansion and shifting global monetary policies—reassert their influence.
This juxtaposition of short-term caution and long-term optimism highlights the complexity of current precious metals trading. While day traders and swing speculators must navigate volatile, range-bound conditions from day to day, long-term investors are increasingly viewing periodic market dips as strategic accumulation opportunities within a secular bull market.
Chronology of the Recent Gold Cycle
To fully understand gold’s current standing, it is helpful to review the chronological progression of the market over the past two quarters:
- August: Gold reaches historic multi-year highs near $4,680 per ounce, driven by intense safe-haven flows, geopolitical friction, and robust central bank accumulation.
- September to October: A sustained period of profit-taking and technical correction sets in. Sellers gradually establish a pattern of lower highs, steadily eroding the summer gains.
- Early November: Gold attempts a notable recovery rally, climbing back toward the $4,120 level. However, the move stalls due to insufficient buying volume and broader macroeconomic resistance.
- Mid-November: Rejected at overhead resistance, the metal experiences a sharp sell-off, erasing the November gains and driving prices down to test the $3,875 support zone.
- Present: Gold trades near $3,875 with an active 24-hour volume of $12.74 billion, as traders weigh improving momentum indicators against dominant short-term technical resistance.
Macroeconomic Implications and Central Bank Demand
Beyond charts and technical oscillators, the broader fundamental backdrop for gold remains tied to global macroeconomic policy and central bank reserve management. Over the past several years, official sector purchases—particularly by emerging market central banks seeking to diversify away from traditional fiat reserves—have provided a formidable structural floor for gold prices. Even as retail and speculative futures markets experience cyclical liquidations, physical demand from sovereign buyers has consistently absorbed excess supply during major market corrections.
Furthermore, ongoing debates surrounding global interest rate trajectories, inflationary pressures, and currency stability continue to influence investor sentiment. While higher-than-expected borrowing costs can occasionally pressure non-yielding assets like gold by increasing the opportunity cost of holding them, persistent structural deficits and geopolitical fragmentation ensure that gold retains its foundational appeal as the ultimate decentralized reserve asset.
Broader Market Impact and What to Watch
As market participants prepare for the weekend close, the immediate priority for gold is price stabilization. The ability of buyers to defend the $3,875 support zone will dictate whether the market can build a reliable base for a December rally or whether further downside exposure is inevitable.
Traders are advised to monitor key technical parameters closely: a decisive break above the immediate descending resistance trendline would signal a shifting short-term sentiment, whereas a rejection at resistance coupled with a breakdown in support could accelerate selling pressure toward lower psychological tiers. Ultimately, gold’s weekend performance will depend on whether steady accumulation by long-term participants can successfully outweigh the momentum-driven caution of short-term speculators.