

XRP has staged a notable recovery toward the psychologically significant $1 threshold, drawing intense focus from retail traders and institutional market participants alike. Despite this recent upward price action, the broader technical framework for Ripple’s native asset continues to exhibit pronounced bearish characteristics. Market observers are closely monitoring a precarious balance between improving short-term momentum signals—highlighted by substantial whale withdrawals from centralized exchanges—and heavy overhead resistance from key moving averages. As the digital asset navigates this volatile period, traders are heavily scrutinizing critical inflection points, including immediate support near $0.95 and a longer-term Gaussian Channel boundary sitting at $0.84.
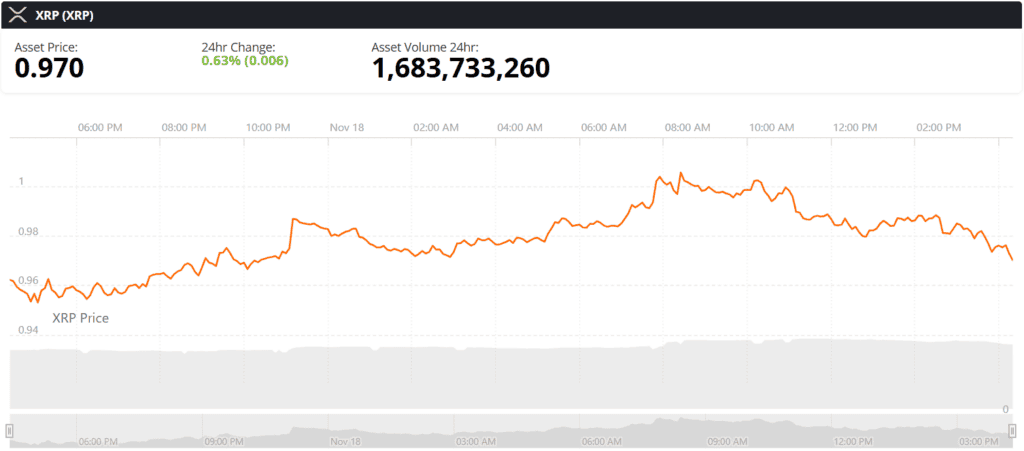
The recent price trajectory of XRP reflects a classic tug-of-war between short-term accumulation strategies and a macro-level downward trend. Changing hands near $0.9991, the token recently printed a modest intraday gain of approximately 4.47%. However, this relief rally follows a prolonged period of downside pressure that saw values retreat significantly from local highs above $1.50. Analysts across the cryptocurrency landscape are parsing conflicting signals from technical indicators, on-chain metrics, and derivative markets to determine whether this latest bounce represents the genesis of a durable trend reversal or merely a temporary respite within a broader market correction.
Decoding Technical Indicators: Short-Term Optimism Versus Macro Pessimism
A granular examination of TradingView technical summaries for the XRP/USD pair on Bitstamp reveals a striking dichotomy between short-term oscillators and longer-term moving averages. The overarching summary currently maintains a Sell rating, underscored by 14 sell signals, seven neutral readings, and a mere five buy signals. This aggregate score encapsulates the skepticism still prevalent among institutional quantitative models regarding the durability of the current recovery.

A deeper dive into the indicator breakdown exposes the nuance behind these numbers. Oscillators are currently flashing a tentative Buy rating, boasting four buy signals against six neutral stances and only one sell signal. This suggests that the intense selling pressure that drove the market downward may be temporarily abating. Momentum oscillators such as the 14-period Relative Strength Index (RSI) hover at 26.23, placing XRP firmly below the traditional 30 threshold associated with oversold conditions. Concurrently, the Commodity Channel Index (CCI) at -103.48 and the Williams Percent Range at -85.85 corroborate that the asset has been trading near the absolute nadir of its recent range.
While such deeply oversold readings historically precede relief bounces, veteran traders caution that oversold conditions do not inherently confirm a definitive market bottom. Providing a stark counterpoint to the oscillators, the Moving Average Convergence Divergence (MACD) remains entrenched in negative territory at -0.09623. This bearish reading demonstrates that underlying downward momentum has not fully dissipated. Furthermore, the moving averages themselves maintain a decisive Strong Sell assessment, anchored by 13 sell signals, one neutral reading, and a solitary buy signal. This technical rift emphasizes that while day traders may find opportunities in short-term volatility, trend-following strategies continue to signal caution.
On-Chain Dynamics: Whale Accumulation and Exchange Outflows
Beneath the surface of spot price action, on-chain analytics provide fascinating insights into how large-scale investors are positioning themselves during this correction. Between November 10 and November 18, net whale withdrawals from major platforms like Binance reportedly exceeded $127 million. In the lexicon of cryptocurrency market structure, substantial exchange outflows by institutional-tier holders or high-net-worth individuals are frequently interpreted as a bullish development. Such movements typically indicate that large investors are transferring assets out of trading venues and into private cold storage custody, effectively removing immediate selling supply from the open order books.
Nevertheless, seasoned on-chain analysts urge prudence when interpreting these figures. Exchange outflows do not automatically equate to fresh retail buying or long-term accumulation; internal wallet rebalancing, custodial shuffles, and over-the-counter (OTC) settlement preparations can occasionally skew these metrics. Compounding this ambiguous on-chain picture, broader institutional investment products have displayed lackluster demand. Data compiled from United States spot XRP exchange-traded funds (ETFs) revealed approximately $19.1 million in net outflows during the mid-November trading window. This institutional capital flight suggests that traditional finance vehicles have yet to align with the localized bullish momentum observed on spot exchanges.
Short-Term Breakouts and the Quest for Sustainable Momentum
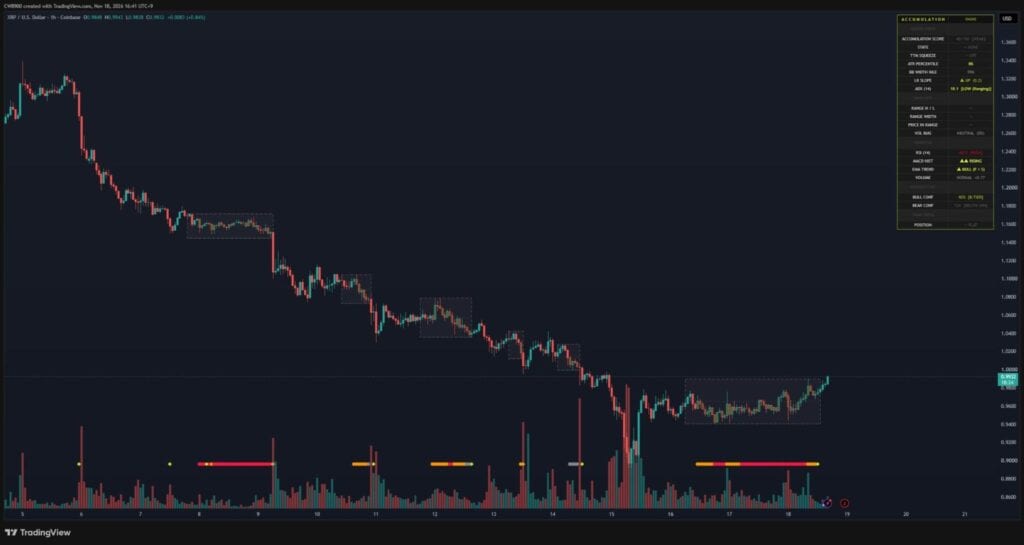
Short-term market structure received a shot in the arm following a brief two-day accumulation phase that culminated in a confirmed breakout. CryptoQuant-verified analyst CW highlighted that XRP successfully pierced the upper boundary of its tight consolidation range, supported by improving MACD and Exponential Moving Average (EMA) crossovers. This localized breakout offered immediate relief to market participants who had weathered weeks of relentless downside volatility following the asset’s rejection above $1.50.
Despite these encouraging developments, market technicians emphasize that escaping a minor consolidation range does not invalidate a macro downtrend. The recovery immediately encounters a formidable ceiling of moving averages acting as overhead resistance. On the short-term timeframe, the 10-day EMA resides near $1.0205, closely mirrored by the 10-day Simple Moving Average (SMA) at $1.0163. Both indicators sit directly above current market prices, actively enforcing Sell signals.
The resistance landscape becomes increasingly formidable across extended horizons. The 20-day EMA hovers near $1.0997, while the 50-day EMA stretches to $1.2161. Further up, the critical 200-day EMA stands firm at approximately $1.3246. For XRP to establish a credible claim of a structural regime change, it must systematically reclaim these moving average milestones through sustained, high-volume buying interest.
The Gaussian Channel and Long-Term Cycle Support Zones
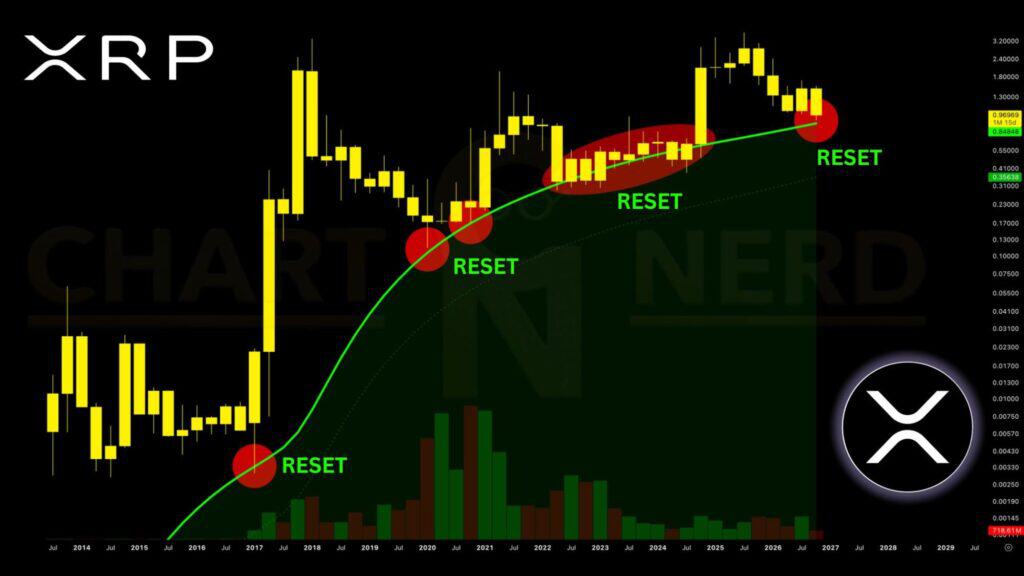
For market participants eyeing the macro landscape, attention has increasingly shifted toward longer-term valuation models. Prominent market analyst ChartNerdTA recently drew attention to the upper regression band of XRP’s three-month Gaussian Channel, located near the $0.84 mark. The Gaussian Channel is a sophisticated trend-following indicator that employs Gaussian filtering to map statistical price bands around a smoothed moving average, assisting analysts in identifying extreme deviations from historical trends.
Historical analysis of XRP’s multi-year charts reveals that previous touches of this upper regression band have repeatedly coincided with cycle bottoms and major macro market resets, often explicitly marked by significant consolidation phases before massive multi-year expansions. If the current corrective phase deepens and broader market conditions deteriorate, the $0.84 region stands out as a formidable technical floor. This perspective is further contextualized by earlier structural projections identifying potential downside retest zones near $0.73, while the broader invalidation threshold for the prevailing bearish macro setup remains anchored in the $1.80 to $2.00 price corridor.
Wedge Formations and Critical Pivot Levels to Watch
Further reinforcing the necessity of strict risk management, TradingView contributor VincePrince outlined a massive descending wedge formation on the weekly timeframe. This macro pattern incorporates an ascending trendline, the lower boundary of the wedge, and the 500-period EMA as a collective defense line that must hold to preserve the structural integrity of the chart. A failure to defend this multi-layered support zone would severely compromise the macro setup, leaving the digital asset vulnerable to accelerated losses.
Conversely, immediate downside defense currently relies heavily on the $0.95 to $0.98 price band. Classic and Fibonacci pivot calculations position the crucial S2 support level near $0.9775, while Woodie’s S2 pivot calculations place localized support around $0.9561. These overlapping mathematical models explain why algorithmic traders and short-term speculators are fiercely defending this narrow corridor. A decisive, sustained breakdown beneath the $0.95 threshold would likely accelerate liquidations and pivot market focus squarely toward the aforementioned $0.84 Gaussian Channel boundary.
Implications and Outlook for Market Participants
As XRP navigates this delicate crossroad, its immediate fate hinges on the delicate interplay between eager retail buyers defending psychological thresholds and entrenched macroeconomic headwinds. The convergence of over $127 million in whale withdrawals and improving short-term oscillator readings provides a solid foundation for potential relief rallies. However, the heavy burden of moving average resistance, negative MACD readings, and subdued institutional ETF inflows serve as a stark reminder of the market’s underlying fragility.
To validate a sustained recovery, bulls must aggressively reclaim the $1.02 and $1.10 resistance tiers while successfully defending the $0.95 support floor. Failure to maintain these vital zones risks dragging XRP toward historical cycle-reset markers near $0.84. As the broader cryptocurrency market evaluates its next directional leg, traders and investors are advised to maintain rigorous risk mitigation protocols, closely monitoring volume confirmation and order-book depth across these critical technical battlegrounds.