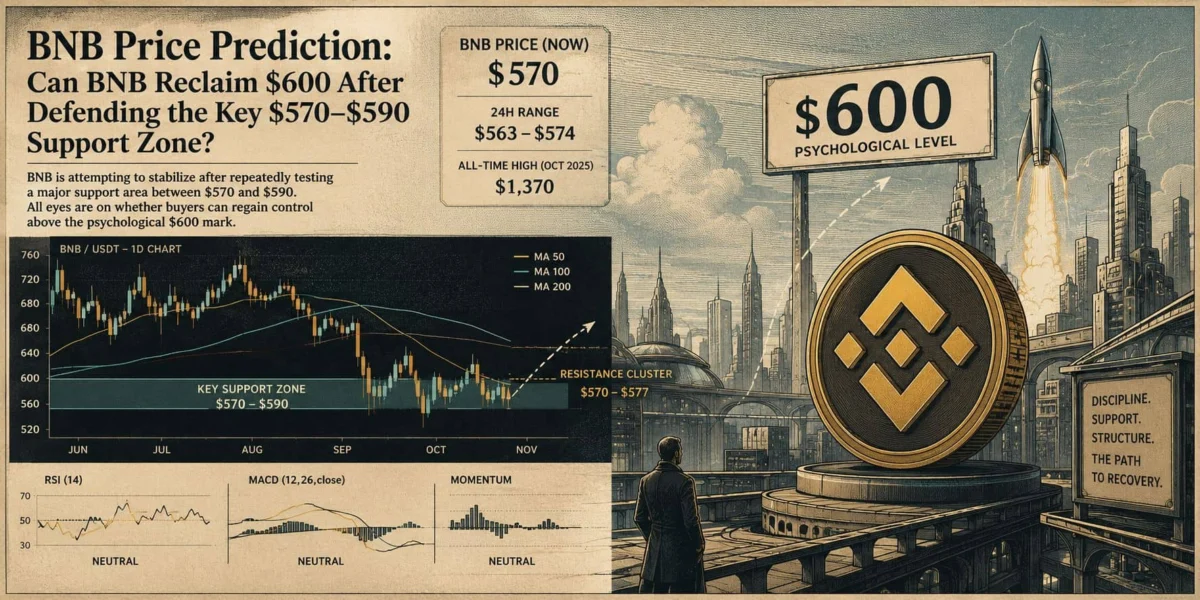
Binance Coin (BNB) is currently undergoing a critical phase of price stabilization, repeatedly testing a significant support area ranging between $570 and $590. This prolonged consolidation has heightened focus among market participants on whether sustained buying pressure can emerge to push the token decisively above the psychologically important $600 threshold. The current price action indicates a market at a crossroads, with technical indicators presenting a mixed outlook and analysts watching for clear signals of either recovery or further downside.
Current Market Snapshot: A Tight Range at Key Support
As of the latest market data, BNB is trading near $570, fluctuating within a narrow 24-hour range of approximately $563 to $574. This tight trading band underscores the immediate battle between buyers and sellers at this pivotal support level. The token’s current valuation remains a significant distance from its October 2025 all-time high of approximately $1,370, highlighting the substantial correction it has undergone from its previous peak. This deep retracement means that any sustained recovery would need to overcome considerable overhead resistance accumulated during the downtrend.
Technical analysis reveals a nuanced picture. Short-term momentum indicators are largely neutral, suggesting a lack of strong directional conviction in the immediate term. However, the broader trend, as reflected by moving averages, continues to lean towards a more defensive or bearish structure. The immediate challenge for BNB is to establish a sustained recovery above the $570–$577 resistance cluster before any meaningful attempt at reclaiming the crucial $600 mark can be considered viable.
The Significance of the $570-$590 Support Region
The $570–$590 price band has emerged as a central point of interest in recent BNB technical analyses. This region has, on multiple occasions, attracted buying interest, preventing a more substantial price collapse. However, the repeated testing of any support zone can also be a double-edged sword; while it confirms demand, persistent pressure without a strong rebound can gradually weaken the support, making it more susceptible to a decisive break.
Specifically, market strategist @Cipher2X recently identified the $566–$567 area as a key demand zone within this broader support region. The premise is that a successful defense of this particular area could pave the way for BNB to target a liquidity pocket around $587–$588, where previous highs might attract further market activity, potentially triggering short-covering or fresh buying. While BNB has managed to hold above this immediate short-term reference, the recovery has been modest, lacking the robust momentum required to challenge higher resistance levels.
The distinction between the $566–$567 immediate support and the broader $570–$590 weekly battleground is crucial. The former represents a short-term defense line, while the latter encompasses the wider range that, if breached, would significantly undermine the current stabilization thesis. A sustained break below the entire $570–$590 region would signal a concerning shift in market dynamics, potentially opening the door to deeper corrections.
Technical Indicators Paint a Mixed Picture

A deeper dive into various technical indicators, as per recent TradingView data, reveals a cautious and somewhat ambiguous outlook for BNB. With the token quoted near $568.28, the overall technical summary remains squarely in "Neutral" territory, reflecting the prevailing indecision.
Oscillator readings provide little definitive evidence of a strong directional trend. The 14-period Relative Strength Index (RSI), a popular momentum oscillator, stands at 45.41. This reading places it below the midpoint of 50, indicating a slight bearish bias in momentum, but it is still well above the traditional oversold territory of 30, suggesting that selling pressure has not reached an extreme. Similarly, the Stochastic %K is at 35.81, and Williams %R is at -65.08, both of which are also in neutral zones, failing to signal either strong buying or selling impetus.
Other momentum indicators further confirm this lack of clear trend strength. The Commodity Channel Index (CCI) is at -16.32, and the Average Directional Index (ADX) is at 17.18. An ADX reading below 20 typically indicates a weak or non-trending market, corroborating the observation that BNB is currently consolidating without a dominant directional force. The Awesome Oscillator is -0.68, while the Stochastic RSI Fast is 15.38. Bull Bear Power registered -5.56, and the Ultimate Oscillator was 48.81. Collectively, these readings suggest that BNB is not currently exhibiting a broad-based momentum signal in either direction, trapped in a state of equilibrium.
Despite the prevalence of neutral signals, there are some conflicting indications within the oscillator group. The Momentum (10) indicator generated a Sell signal, suggesting a recent deceleration in price appreciation. Conversely, the Moving Average Convergence Divergence (MACD) Level (12, 26) produced a Buy signal at -3.64, hinting at a potential bullish crossover in the near term, albeit from a negative position. This divergence between indicators underscores the current market uncertainty, suggesting that traders are awaiting further confirmation rather than committing to a clear trend.
Moving Averages: A Persistent Bearish Undercurrent
The structure of moving averages presents a less optimistic view, largely indicating an environment that is not yet conducive to an immediate bullish reversal. Short-term exponential moving averages (EMAs) and simple moving averages (SMAs) are positioned close to the current price but predominantly above it, acting as immediate resistance.
Specifically, the 10-period EMA is at 571.70, and the 10-period SMA is at 572.93. Slightly higher, the 20-period EMA stands at 573.33, and the 30-period EMA is at 577.32. These levels collectively form an initial resistance band roughly spanning $570 to $577. For BNB to improve its short-term technical outlook, it must not only reclaim this cluster but also demonstrate the ability to hold above it, converting these resistance levels into new support.
The longer-term moving averages pose a more significant challenge, reinforcing the broader bearish trend. The 50-period EMA and SMA are situated at 587.16 and 586.70, respectively, indicating a stronger resistance barrier. Further up, the 100-period EMA is at 611.84, with the 100-period SMA at 613.61. The most formidable resistance lies at the 200-period EMA and SMA, positioned around $661.38 and $663.92. The fact that these longer-term averages remain well above the current market price signifies that the broader trend for BNB is still under considerable downward pressure.
Among the moving averages, only a few exceptions offer a glimmer of bullish hope. The Hull Moving Average (9) generated a Buy signal at 568.18, suggesting a very short-term positive momentum shift. The Ichimoku Base Line remained Neutral at around 564.89. However, the overwhelming majority of moving average readings are tilted towards Sell signals, with 12 Sell, one Neutral, and one Buy. This imbalance strongly suggests that BNB requires more than a temporary bounce to establish a convincing trend reversal; it needs a significant and sustained shift in market dynamics.
The Psychological $600 Mark: A Pivotal Battleground

The $600 level has emerged as a crucial technical and psychological dividing line for BNB. A decisive move above this threshold would signify more than just reclaiming a round number; it would place BNB back above the broader weekly support area that has been repeatedly tested, potentially improving overall market sentiment. Furthermore, breaking above $600 would mean surpassing the short-term moving-average cluster, bringing the token closer to the classic pivot point near $604.37.
Weekly analysis from DukesMarketAnalysis similarly underscores the importance of $600 for the bulls. The assessment explicitly states that "Bulls Need to Reclaim $600," arguing that a convincing recovery above this level would serve as an early and strong indication of improving sentiment. The same analysis, however, warns that BNB’s broader trend remains vulnerable. Key long-term indicators, such as the 21-week and 8-week EMAs, are described as bearishly crossed, while the RSI remains below 50, indicating a lack of strong bullish momentum on a weekly timeframe. The StochRSI, while close to oversold territory, does not yet provide definitive evidence that selling pressure has been fully exhausted.
Therefore, $600 is not merely another price point but a meaningful confirmation level. A breach of this level, particularly if accompanied by an increase in trading volume, would offer a far more constructive signal than a temporary intraday spike. It would indicate a fundamental shift in buyer conviction and potentially mark the beginning of a more sustained recovery.
BNB’s Ecosystem and Broader Market Context
To fully appreciate BNB’s current predicament, it is essential to consider its role within the broader cryptocurrency ecosystem. BNB is the native cryptocurrency of the Binance Chain and Binance Smart Chain (now BNB Chain), two prominent blockchain networks associated with Binance, the world’s largest cryptocurrency exchange by trading volume. Its utility extends beyond mere trading, encompassing discounted trading fees on Binance, participation in token sales on Binance Launchpad, and powering transactions and smart contracts on the BNB Chain. The health of the Binance ecosystem and the broader crypto market sentiment significantly influence BNB’s price.
The October 2025 all-time high near $1,370 occurred during a period of robust market expansion and heightened interest in decentralized finance (DeFi) and non-fungible tokens (NFTs), areas where the BNB Chain played a significant role due to its lower transaction fees and faster processing times compared to Ethereum. The subsequent correction can be attributed to a combination of factors, including broader market downturns, regulatory pressures on centralized exchanges, and a general cooling off of speculative fervor in the crypto space. Understanding this historical context helps frame the current struggle for stabilization as part of a larger market cycle.
Analyst Perspectives: $588 Liquidity or $537 Retest?
The near-term price structure for BNB presents two contrasting, yet equally plausible, scenarios based on current technical analysis.
On the bullish side, the $587–$588 area, as identified by @Cipher2X, represents a significant potential liquidity target. If BNB successfully navigates and clears the immediate $570–$577 resistance cluster, this zone would likely come into focus. A successful push through $588 would then set the stage for a challenge of the broader $600 threshold. For the technical picture to become genuinely constructive, BNB would need to not only clear $588 but also establish sustainable support above $600. Such a sequence of events would demonstrate that buyers are capable of both defending lower support zones and absorbing selling pressure at successive resistance levels, signaling a genuine shift in market control.
Conversely, a failure to defend the critical $570–$590 region would significantly heighten the risk of a deeper correction. DukesMarketAnalysis highlighted the recent $537 low as a crucial downside level that could quickly return to focus if BNB fails to reclaim $600 and the current support ultimately gives way. Should this support falter, the wider pivot calculations illustrate the potential for a sharp shift in sentiment. While the classic pivot is around $604.37, a calculated S1 (Support 1) sits near $481.43. These broader pivot levels, derived from historical price ranges, serve as significant reference points, suggesting the potential severity of a downside move if the current defensive lines are breached.

For the immediate future, the most relevant technical levels remain closer to the current price action: approximately $566–$567 acting as immediate downside support, $570–$577 as the first resistance band, $587–$588 as the next upside target for liquidity, and the $600–$604 range as the key confirmation zone for a potential trend reversal.
Key Levels to Watch and Future Outlook
BNB’s immediate outlook remains precariously balanced, caught between the potential for a nascent recovery and the persistent risk of another support breakdown. The confluence of neutral momentum indicators and a bearish moving average structure creates an environment of uncertainty, demanding careful observation from traders and investors.
The first critical level for buyers to defend is the $566–$567 zone, which has recently demonstrated demand and prevented deeper declines. A failure to hold this area would immediately bring the recent $537 low into sharp focus as the next significant downside reference.
On the upside, BNB faces a series of escalating challenges. It must first overcome the $570–$577 moving-average cluster, which represents a formidable initial resistance. Following this, the $587–$588 liquidity area stands as the next key upside target. A sustained and convincing move above the $600 mark would provide the strongest technical signal of a potential trend reversal, reinforced by the classic pivot near $604.37 residing in the same vicinity.
The indicator mix, with RSI at 45.41 and ADX at 17.18, suggests that the market has not yet reached an extreme oversold condition, implying that further downside cannot be entirely ruled out. Simultaneously, the concentration of longer-term moving averages well above the current price underscores the considerable overhead resistance that BNB must conquer.
The pivotal question for BNB’s price prediction is not merely whether the token can briefly trade above $600. The more meaningful test will be whether BNB can reclaim and hold that level after successfully defending the $570–$590 support region. If buyers achieve this, the technical structure would begin to show signs of improvement, potentially opening the path toward higher resistance levels, including the 100-period moving averages around $612-$614 and eventually the 200-period averages near $660. However, if the current support fails before a robust recovery develops, the recent $537 low could once again become a critical point of retest. Until one of these scenarios is definitively confirmed, BNB remains entrenched in a battle between a fragile support base and a broader trend that has yet to turn decisively bullish.