Ethereum (ETH) continues to grapple with persistent bearish pressure, trading firmly below the critical $1,700 threshold as market participants contend with a pervasive sense of apathy and uncertainty. The cryptocurrency’s price action has been notably directionless, exhibiting neither a convincing recovery nor an aggressive breakdown, a scenario that has frustrated investors across the spectrum. However, a detailed analysis of network activity data by CryptoOnchain, leveraging insights from CryptoQuant, reveals a significant divergence that challenges the superficial narrative of a network in structural decline. Instead, the data suggests a strategic consolidation of capital by larger entities, even as retail engagement wanes.
A Deep Dive into Ethereum’s On-Chain Transaction Dynamics
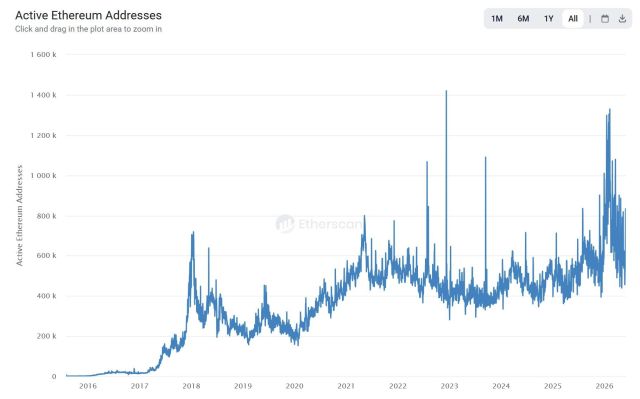
Over the past week, a striking pattern has emerged in Ethereum’s on-chain transaction metrics. Daily transactions originating from typical user wallets have witnessed a substantial decline of approximately 43%. In isolation, such a statistic might lead to the conclusion that the Ethereum network is losing engagement and relevance, particularly during a challenging market period characterized by dampened investor sentiment. Yet, a more granular examination of the data reveals a more nuanced and potentially optimistic picture for long-term holders.
Counterbalancing this decrease in transaction volume, the average value moved per transaction on the Ethereum network has surged by over 184%. Even more tellingly, the median transfer size has experienced an even sharper increase. This indicates a clear shift: while Ethereum is processing fewer individual transactions, the transactions that are occurring are dramatically larger in value compared to previous periods. This specific combination of declining transaction counts and escalating average transaction values is a recognizable signature of on-chain behavior observed during previous periods of market stress and consolidation.

Historically, such patterns signify that smaller, routine participants—often referred to as retail investors—tend to step aside, reduce their activity, and await clearer market signals. Conversely, larger holders, frequently termed "whales" or institutional investors, continue to operate, moving substantial capital in fewer but more significant transactions. These large transfers typically reflect deliberate strategic positioning, such as accumulation, rebalancing, or migration to cold storage, rather than routine network usage or speculative trading. CryptoOnchain’s analysis posits that this divergence is not indicative of a fading network but rather the hallmark of capital concentrating into fewer, more significant hands at current price levels, suggesting a potential underlying strength amidst surface-level weakness.
The Broader Consolidation Setup: Supply Contraction Meets Accumulating Demand
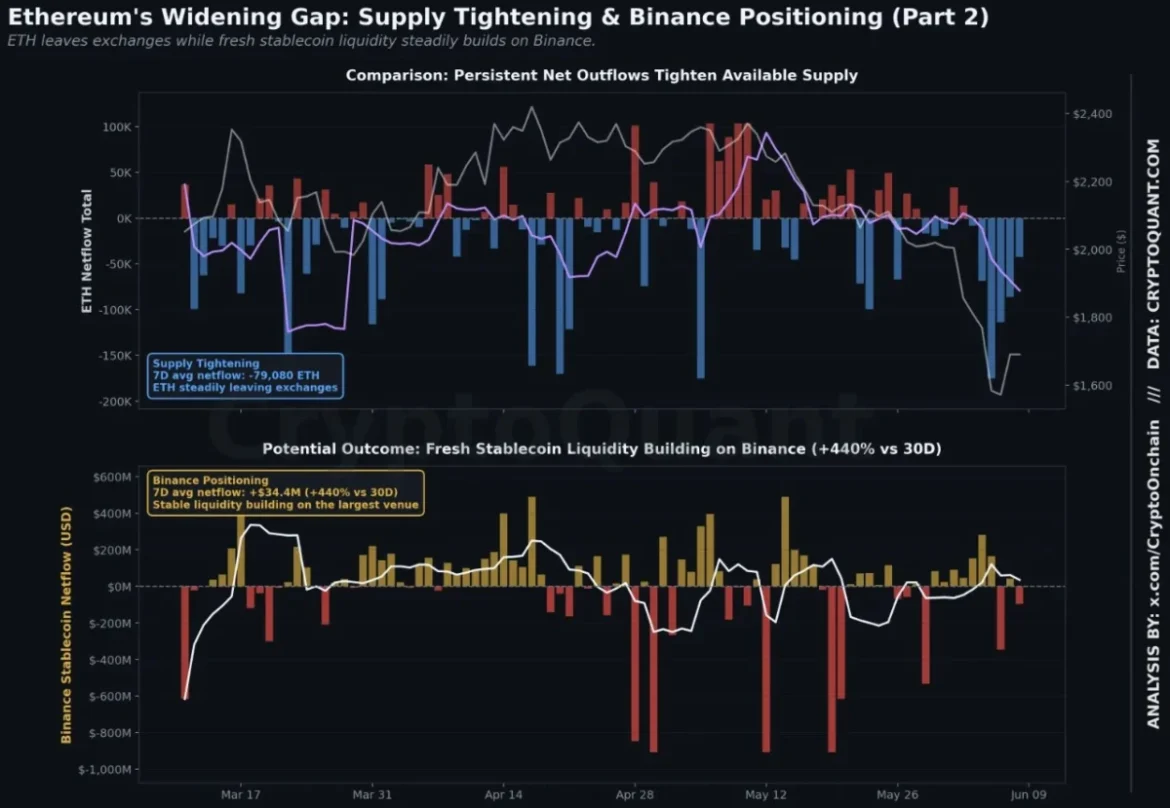
The on-chain transaction divergence is further corroborated by broader flow data, which confirms a consistent behavioral pattern across multiple independent indicators. Total Ethereum netflows from exchanges remain deeply negative, indicating a significant withdrawal of ETH from centralized trading platforms. Approximately -79,080 ETH have left exchanges, signifying that large volumes of the cryptocurrency are continuously being moved into private wallets or cold storage rather than accumulating on exchanges where they would be readily available for immediate sale. This sustained exodus of ETH from exchanges points to an ongoing contraction of spot supply, reducing the readily available float for trading.
Simultaneously, fresh capital is actively positioning itself on major exchanges, particularly Binance, through stablecoin channels. Stablecoin netflows into Binance have registered a strong positive influx of +$34.4 million, representing a staggering 440% increase compared to the 30-day average. This influx of stablecoins suggests that significant buying power is arriving on exchanges, poised to be deployed. This trend coincides with the observed withdrawal of spot ETH, creating a scenario where potential demand is accumulating on the buy side while the available supply is tightening.
Further reinforcing this narrative, Open Interest (OI) on Binance for Ethereum derivatives has expanded by approximately 9% over the quarter. This expansion confirms that larger participants are quietly building derivatives exposure, likely through futures or options contracts, alongside the observed stablecoin inflows. This combined activity – spot ETH leaving exchanges, stablecoins entering exchanges, and increasing derivatives exposure – paints a comprehensive picture of a market structure where the available supply of Ethereum is being constrained, while a growing pool of potential demand is being strategically amassed by sophisticated players.

While this specific combination of market dynamics does not inherently guarantee an immediate price reversal, it establishes a crucial pre-condition that has historically preceded more pronounced market moves. Structural setups of this nature typically require a catalyst to activate them. However, they describe an environment where a tightening supply meets concentrated buying power, positioning the participants who remained active and accumulated during the phase of market apathy to benefit disproportionately when broader market sentiment eventually shifts and demand returns.
Ethereum’s Technical Landscape: Navigating New Lows and Resistance
From a technical perspective, Ethereum’s price action on the daily timeframe remains firmly under bearish control. Trading near $1,630, ETH recently suffered a sharp breakdown from a multi-month consolidation pattern that dominated trading between February and May of the current year. This consolidation phase saw Ethereum oscillate within a relatively defined range, repeatedly testing demand and supply zones.
The most significant technical development in recent weeks has been the decisive loss of the crucial $1,800-$1,900 support zone. This area had previously acted as a robust demand zone throughout the first half of the year, consistently attracting buyers and preventing further declines. Once this critical floor failed, selling pressure rapidly accelerated, pushing ETH to fresh 2026 lows, momentarily touching levels near $1,500. This breakdown signifies a clear shift in market structure, indicating that sellers have gained a definitive upper hand.
Examining the broader market structure, the sequence of highs and lows for Ethereum remains unequivocally bearish. The recovery witnessed between April and May peaked near $2,400, forming a lower high relative to previous rallies earlier in the year. Following this peak, sellers regained control, initiating a downtrend characterized by a series of successive lower highs and lower lows, culminating in the recent collapse through key support. Furthermore, the current price is trading well below all major moving averages—the 50-day, 100-day, and 200-day—confirming a pervasive weakness across all significant timeframes and indicating a strong bearish trend.

Volume behavior provides additional insight into the recent selloff. The aggressive downward move that saw ETH break critical support was accompanied by one of the largest volume spikes seen in months. This surge in trading volume signals significant and aggressive participation from sellers, confirming the conviction behind the breakdown. While a short-term bounce did emerge from the $1,500 area, buyers have, to date, failed to reclaim any meaningful resistance levels, suggesting that the rebound lacks sustained momentum.
Historical Context and Broader Market Sentiment
The current market environment for Ethereum and the broader cryptocurrency space is characterized by a confluence of factors. Macroeconomic headwinds, including persistent inflation concerns, rising interest rates, and geopolitical uncertainties, have dampened investor appetite for riskier assets like cryptocurrencies. Regulatory scrutiny has also intensified globally, creating an additional layer of uncertainty for market participants. These factors contribute significantly to the prevailing apathy and reluctance among retail investors, prompting them to withdraw from active trading.
Historically, periods of retail withdrawal and whale accumulation have often preceded significant market movements. During the bear markets of 2018 and 2022, similar patterns of consolidation by larger holders were observed. These periods, while painful for many, ultimately laid the groundwork for subsequent bull runs, as concentrated supply and accumulating demand created fertile ground for upward price momentum once sentiment eventually shifted. Analysts often refer to these phases as "smart money" accumulating assets from "weak hands." The current divergence in transaction patterns and netflows suggests that such a dynamic may once again be playing out for Ethereum.
The Immediate Battleground and Future Outlook

The immediate battleground for Ethereum bulls and bears is the $1,500-$1,550 region. This zone now represents the most important support level for the year. A sustained hold above this area could provide Ethereum with a crucial base from which to potentially stabilize after a nearly 35% decline from its May highs. Establishing a firm bottom here is paramount for any hope of a recovery.
However, for a durable recovery to materialize, Ethereum must reclaim the former support zone around $1,800. Until this critical psychological and technical barrier is overcome, any rallies are likely to be viewed as corrective moves within the broader downtrend rather than the inception of a sustainable uptrend. The path of least resistance currently remains to the downside, with sellers maintaining control of the narrative.
The implications of this structural setup are significant. Should a catalyst emerge—be it a shift in macroeconomic policy, a positive regulatory development, or a significant upgrade within the Ethereum ecosystem—the tightening float and concentrated buying power could lead to a rapid and pronounced upward price movement. The participants who have strategically positioned themselves during this period of apathy and consolidation stand to benefit disproportionately from such a shift in sentiment. Conversely, a failure to hold the $1,500-$1,550 support could open the door to further downside, with potential targets in the lower $1,000s, further exacerbating retail fear and potentially leading to capitulation. The market awaits a decisive move, but the underlying data suggests a quiet repositioning beneath the surface of apparent stagnation.