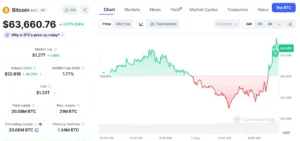
An older Bitcoin roadmap, originally shared by the crypto commentator known as Klarck in February, has garnered renewed attention within the digital asset community as Bitcoin’s price trajectory has moved remarkably close to one of the key downside zones projected months earlier. This resurgence of interest in a previously published analysis underscores the cyclical nature of market sentiment and the enduring utility of technical charting, even as market conditions evolve. The original post, which outlined a potential path for Bitcoin, is not new commentary but rather a historical forecast whose relevance has been amplified by recent price action, prompting traders and analysts to revisit its intricate details.
The Resurgence of an Early-Year Forecast
The cryptocurrency market, particularly Bitcoin, is characterized by its volatility and rapid shifts, yet certain patterns and analytical frameworks often resurface as price movements align with past predictions. Klarck’s February roadmap, initially shared on social media platform X, laid out a multi-stage projection for Bitcoin. It posited an initial surge towards $83,000, followed by a gradual correctional descent into a specified range of $65,000 to $55,000. This downturn was anticipated to precede a two-week accumulation phase, after which Bitcoin was expected to transition back into a growth trajectory, ultimately targeting a price point of $140,000 per BTC.
What makes this particular forecast noteworthy now is not its recency but its uncanny alignment with current market developments. Bitcoin’s price has recently approached the upper boundary of the $65,000-$55,000 downside range, a development that has naturally led market participants to re-evaluate the roadmap’s potential accuracy. This scenario serves as a powerful illustration of how technical analysis, even when months old, can regain prominence when real-world price movements begin to mirror its predictions. It is crucial, however, to differentiate between a validated segment of a prediction and an endorsement of the entire forecast; the latter upside target of $140,000 remains a speculative future outcome, contingent on numerous factors.
Klarck’s February Roadmap: A Detailed Look
To understand the current market interest, a deeper dive into Klarck’s original projection is essential. In early 2024, as Bitcoin was building momentum towards its pre-halving rally, many analysts were bullish, but Klarck’s roadmap offered a more nuanced view, integrating both significant upside and a subsequent, substantial correction.
-
The Initial Bullish Trajectory: Klarck’s forecast began with a predicted bounce towards $83,000. At the time of its publication in February, Bitcoin was trading significantly lower, making an $83,000 target a bold, yet plausible, extension of the prevailing bullish sentiment. Indeed, Bitcoin subsequently surpassed its previous all-time high of $69,000 in March, reaching peaks above $73,000, demonstrating a strong upward momentum driven by institutional inflows via spot ETFs and anticipation of the halving event. While it did not precisely hit $83,000, the strong upward move aligned with the initial bullish thrust of the roadmap.
-
The Anticipated Downside Correction: The core of the current discussion revolves around the projected gradual drop into the $65,000-$55,000 region. This segment of the roadmap was perhaps the most counter-intuitive when first proposed, especially amidst a roaring bull market. Many market participants often expect parabolic rises without significant pullbacks. Klarck’s inclusion of a substantial correctional phase showcased an understanding of market cycles and the necessity of price discovery and consolidation after rapid gains. The current approach of Bitcoin’s price to this range highlights the foresight embedded in this specific prediction.
-
The Accumulation and Subsequent Rally Projection: Following the predicted downside, the roadmap envisioned a two-week accumulation phase within the $65,000-$55,000 zone. This phase would be characterized by a stabilization of price, reduced volatility, and a potential shift in market control from sellers to buyers, indicating a period of re-distribution before the next leg up. The ultimate projection of $140,000 per BTC after this accumulation phase represents a highly optimistic long-term target, contingent upon the successful execution of the preceding phases. Such a target would signify a significant expansion beyond previous all-time highs, reflecting a potential new cycle peak.
Market Dynamics Leading to Validation
The path Bitcoin has taken since February provides the context for the renewed interest in Klarck’s roadmap. The market environment has been complex, influenced by a confluence of technical, fundamental, and macroeconomic factors.
-
Bitcoin’s Post-Halving Performance: The fourth Bitcoin halving, which occurred in April 2024, was a highly anticipated event. Historically, halvings have been precursors to significant bull runs, as the reduction in new supply issuance typically exerts upward pressure on price. However, the market reaction post-halving has been less straightforward than some expected. While Bitcoin had already surged to new all-time highs prior to the halving, the period immediately following has seen consolidation and a gradual retracement from those peaks. This divergence from a simple "up-only" narrative aligns with the corrective phase outlined in Klarck’s roadmap.
-
Macroeconomic Headwinds and Liquidity Shifts: Global macroeconomic conditions have played a crucial role in shaping investor sentiment across all asset classes, including cryptocurrencies. Persistent inflation, higher-for-longer interest rate policies from central banks like the U.S. Federal Reserve, and geopolitical uncertainties have created a risk-off environment at various points. These factors can reduce the appetite for riskier assets such as Bitcoin, contributing to downward price pressure. Furthermore, shifts in global liquidity, often tied to central bank policies, can influence capital flows into and out of the crypto market, impacting Bitcoin’s ability to sustain upward momentum. The market’s reaction to these broader economic forces has contributed to the gradual decline that has brought Bitcoin into the projected downside zone.
-
Technical Indicators and Key Support Levels: From a technical perspective, the approach to the $65,000-$55,000 zone is significant. This range often corresponds with previous areas of strong support or resistance, as well as psychological price levels. For instance, the $60,000 level held considerable significance during the 2021 bull run. As Bitcoin has retreated from its recent highs, various technical indicators, such as moving averages (e.g., the 50-day or 100-day simple moving averages), have converged or intersected around this price band, signaling potential areas where selling pressure might abate, and buying interest could re-emerge. Volume profiles around these levels also become crucial, indicating where significant trading activity occurred in the past and thus where price might find equilibrium.
The Critical $65,000-$55,000 Zone: A Deep Dive
The immediate focus for traders and analysts is squarely on the $65,000-$55,000 price corridor. Its current relevance stems from the fact that it was identified as a key inflection point months in advance.
-
Historical Significance of the Price Band: This particular range holds historical importance for Bitcoin. The $60,000-$65,000 area served as significant resistance in early 2021 before being decisively broken, and later acted as support. Recalling these historical price interactions helps contextualize why this zone might be a battleground for bulls and bears. A sustained break below this range could signal a deeper correction, while a consolidation within it would align with Klarck’s accumulation thesis. The upper end of this zone, near $65,000, represents a crucial line in the sand. If Bitcoin can establish support here, it validates the strength of the buying interest at this level. Conversely, a failure to hold could see price gravitate towards the lower boundary near $55,000, which might align with liquidation cascades for over-leveraged long positions.
-
On-Chain Metrics and Investor Behavior at These Levels: To further gauge the potential for accumulation or breakdown, on-chain metrics offer invaluable insights. Indicators such as Net Unrealized Profit/Loss (NUPL) can show the aggregate profitability of the market. If a significant portion of holders are still in profit, there might be less pressure to sell into a decline. Conversely, if NUPL approaches levels indicating widespread capitulation, it could signal a market bottom. Dormancy flow, which measures the market value relative to the annualized dormancy, can also indicate whether the market is overheating or in a healthy accumulation phase. Long-term holder (LTH) behavior, specifically their accumulation or distribution patterns, within this $65,000-$55,000 zone will be critical. If LTHs begin to accumulate, it suggests confidence in long-term prospects.

-
Potential Scenarios: Accumulation vs. Further Decline: Should Bitcoin stabilize within this zone, Klarck’s prediction of a two-week accumulation phase becomes the next crucial element to observe. This would require Bitcoin to cease printing lower lows, establish a tighter trading range, and demonstrate a noticeable reduction in selling pressure, potentially accompanied by increasing volume on upward movements within that range. Such a phase would suggest that sellers are losing control, and buyers are absorbing available supply. However, if Bitcoin fails to hold the upper end of the $65,000-$55,000 zone, market participants would likely shift their attention to the lower boundary around $55,000 as the next potential liquidity target. A decisive break below $55,000 could indicate a more significant bearish trend, potentially invalidated the accumulation thesis and requiring a re-evaluation of the entire roadmap.
Analyst and Market Reactions to Predictive Models
The renewed focus on Klarck’s roadmap also prompts broader discussions within the analyst community regarding the utility and pitfalls of relying on past forecasts.
-
The Psychology of Validated Predictions: When a specific part of an old prediction aligns with current price action, it often creates a strong psychological effect on market participants. It can instill a sense of confidence in the original analyst and their methodology, potentially leading to increased adherence to the remaining parts of the forecast. This phenomenon, while natural, also carries inherent risks. Confirmation bias can lead individuals to overemphasize validating data while ignoring contradictory signals.
-
The Broader Context of Technical Analysis: Klarck’s roadmap is fundamentally a exercise in technical analysis, which involves studying historical price charts and market data to identify patterns and predict future price movements. The validation of a specific segment of this roadmap reinforces the idea that technical patterns, when interpreted correctly, can offer valuable insights into market psychology and potential future paths. However, technical analysis is rarely a standalone tool. It is often most effective when combined with fundamental analysis (evaluating the intrinsic value of an asset) and an understanding of macroeconomic forces.
-
Cautionary Tales: The Perils of Over-Reliance: There is a clear and present danger in attributing excessive weight to any single, older forecast, no matter how prescient a segment of it appears. Markets are dynamic ecosystems, constantly influenced by new information, shifting macroeconomic conditions, regulatory changes, and unforeseen geopolitical events. A forecast, even if accurate for a period, can rapidly become obsolete. Liquidity conditions can change, institutional interest can wane or surge, and narratives can pivot, all of which can render old predictions inaccurate. Therefore, while Klarck’s roadmap provides a useful reference point, it should not be treated as a definitive trading plan. Instead, it serves as a framework against which current price action can be measured, requiring continuous confirmation from real-time market data and evolving conditions.
Implications for Traders and Investors
The current situation, with Bitcoin testing a previously identified downside zone, carries distinct implications for different types of market participants.
-
Short-Term Trading Strategies: For short-term traders, the $65,000-$55,000 zone represents a critical area for identifying potential entry or exit points. Traders might look for signs of support forming at the upper end of the range, such as bullish candlestick patterns, increased buying volume, or divergence in momentum indicators. Conversely, a breakdown below these levels would signal continued bearish momentum, potentially leading to shorting opportunities or a re-evaluation of long positions. Strict risk management, including stop-loss orders, becomes paramount in such volatile and decisive price areas.
-
Long-Term Investment Considerations: Long-term investors, often referred to as "hodlers," may view this downside zone as a potential accumulation opportunity. If the market indeed enters an accumulation phase as per Klarck’s roadmap, it could present an attractive entry point for those looking to build or add to their Bitcoin positions at a discount relative to recent highs. However, long-term investors also need to consider their own investment thesis, risk tolerance, and time horizon, rather than solely relying on a single forecast. Dollar-cost averaging (DCA) strategies can be particularly effective during periods of price consolidation or moderate decline, mitigating the risk of trying to perfectly time the market bottom.
-
Risk Management and Adaptive Strategies: Regardless of one’s trading or investment style, the current market juncture underscores the importance of robust risk management. This involves not only setting appropriate stop-losses but also diversifying portfolios, avoiding excessive leverage, and maintaining a clear understanding of one’s capital at risk. Furthermore, an adaptive strategy is crucial. While Klarck’s roadmap offers a potential blueprint, market participants must remain flexible and ready to adjust their outlook based on new information, unexpected news events, or a divergence from the predicted path. The ability to pivot is often more valuable than rigid adherence to a single forecast.
The Road Ahead: Beyond the Downside Zone
While the immediate focus is on the $65,000-$55,000 zone, the broader context of Klarck’s roadmap includes a subsequent accumulation phase and a much higher price target.
-
The Accumulation Phase: What to Watch For: If Bitcoin successfully stabilizes within the projected downside zone, the subsequent two-week accumulation phase would be the next critical test. This phase would need to show specific characteristics: declining volatility, reduced daily trading ranges, and a potential "shakeout" of weaker hands, followed by a gradual increase in buying interest without immediately breaking out to the upside. On-chain metrics, such as a rise in the number of addresses holding Bitcoin and an increase in long-term holder supply, could provide evidence of genuine accumulation. Without these signs, the notion of an imminent rebound would remain speculative.
-
The $140,000 Target: A Long-Term Perspective: The ultimate projection of $140,000 per BTC is a long-term target that, if realized, would represent a significant milestone for Bitcoin. Achieving this target would likely require a confluence of factors, including sustained institutional adoption, favorable macroeconomic conditions (e.g., easing monetary policy, renewed risk appetite), and continued network development. While the validation of the current downside zone might lend some credibility to the roadmap’s longer-term aspirations, it is essential to remember that market dynamics can shift dramatically over extended periods. The $140,000 target should be viewed as an ambitious potential outcome rather than a guaranteed future, dependent on the successful navigation of multiple market phases and external influences.
Conclusion: Navigating Market Forecasts with Prudence
Klarck’s February Bitcoin roadmap has re-entered market discourse not as a new signal but as a compelling example of how historical technical analysis can align with current price action. The fact that Bitcoin has approached the predicted $65,000-$55,000 downside zone months after the forecast was made underscores the enduring relevance of well-crafted analytical models. However, this validation of one segment does not automatically guarantee the accuracy of the entire prediction, especially the ambitious $140,000 target.
For market participants, this situation serves as a valuable case study. It highlights the potential utility of technical roadmaps as reference points for understanding market structure and potential inflection zones. Yet, it equally stresses the imperative for caution, continuous re-evaluation, and the integration of real-time data and broader market context. Markets are dynamic, and while history often rhymes, it rarely repeats itself exactly. The coming weeks will be crucial in determining whether Bitcoin establishes the accumulation phase envisioned by Klarck or if it deviates, charting a new course that demands fresh analysis and adaptive strategies from all who navigate its complex landscape.