Hyperliquid (HYPE) is currently undergoing a significant price test, as its recent pullback from the June high of $77 brings a critical resistance zone into sharp focus. This period of consolidation follows a remarkable growth trajectory for the decentralized perpetual futures exchange, underscoring the complexities of asset valuation even amidst strong fundamental expansion. The current technical landscape suggests that HYPE is at a pivotal decision point, where its ability to reclaim key price levels will dictate its short-term trajectory, rather than indicating a confirmed bullish reversal.
Hyperliquid: A Deep Dive into a Decentralized Derivatives Powerhouse
To understand HYPE’s current market dynamics, it’s essential to first grasp the essence of Hyperliquid itself. Hyperliquid is not just another token; it represents the native cryptocurrency of a high-performance Layer-1 blockchain specifically designed for decentralized perpetual futures trading. Unlike many decentralized exchanges (DEXs) that operate on general-purpose blockchains, Hyperliquid’s dedicated infrastructure aims to rival the speed, efficiency, and liquidity of centralized exchanges (CEXs) like Binance or Bybit. Its architecture prioritizes low latency, high throughput, and deep order book liquidity, critical features for derivatives trading where swift execution and minimal slippage are paramount.
The platform’s growth has been nothing short of meteoric. While traditional finance grapples with regulatory hurdles and operational inefficiencies, decentralized finance (DeFi) continues to innovate, with Hyperliquid carving out a significant niche in the derivatives sector. This segment of the crypto market allows traders to speculate on the future price of assets without owning them outright, offering tools for hedging, risk management, and amplified profit potential through leverage. Hyperliquid’s commitment to a decentralized model – promoting self-custody, transparency, and censorship resistance – resonates with a growing segment of the crypto community, positioning it as a formidable challenger to established centralized entities.
Chronology of HYPE’s Ascent and Current Crossroads
HYPE’s journey to its current standing has been marked by rapid expansion, particularly evident in its trading volumes. From a nascent presence in 2023, Hyperliquid’s share of the perpetual futures market has surged dramatically. Data indicates that its volume relative to industry behemoth Binance escalated from near zero in 2023 to a substantial 16.52% by mid-2026. This exponential growth trajectory, with an accelerating pace observed from 2025 onwards, reflects a significant shift in trader preference and confidence towards decentralized platforms.

The token’s price action mirrors this fundamental growth, culminating in a June high of $77. This peak represented a significant milestone, showcasing the market’s bullish sentiment and the increasing recognition of Hyperliquid’s technological prowess and market penetration. However, as is common in highly volatile crypto markets, a period of profit-taking and consolidation has ensued. This pullback has brought HYPE’s price down, leading to the current situation where technical support and resistance levels are being rigorously tested. The market is now keenly observing whether this retreat is merely a healthy correction within an overarching uptrend or a precursor to a more significant bearish phase.
Technical Analysis: Unpacking the Critical Support and Resistance Levels
The current market structure for HYPE is defined by a confluence of technical indicators that point to specific areas of interest for traders. Leading crypto analyst CryptoPatel recently highlighted the $59 region on the HYPE three-day chart as a potentially critical support zone. This area is significant due to a powerful technical confluence, combining a bullish order block, a fair value gap (FVG), and the 0.382 Fibonacci retracement level.
- Bullish Order Block: An order block typically signifies a price range where large institutional buying interest previously entered the market, often leading to a significant upward move. Traders often view these areas as potential re-entry points where demand could resurface.
- Fair Value Gap (FVG): An FVG indicates an imbalance in the market where price moved rapidly in one direction, leaving behind a gap in trading activity. These gaps often act as magnets, attracting price back to "fill" the inefficiency before continuing its trend. A bullish FVG suggests that previous buying pressure was so strong it left an imbalance, and a retest could see buyers step in again.
- 0.382 Fibonacci Retracement: This is a widely used tool in technical analysis to identify potential support or resistance levels during a price correction. A retracement to the 0.382 level suggests a relatively shallow and healthy pullback, often preceding a continuation of the prior trend.
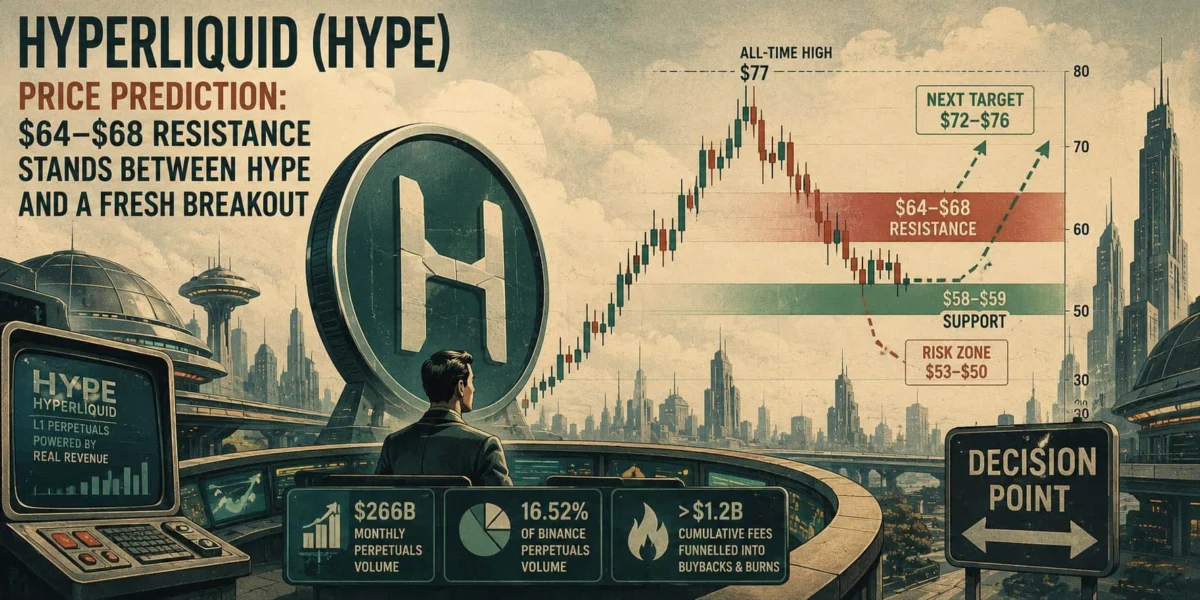
The combination of these three indicators around the $59 mark provides a robust technical foundation, signaling a zone where buying interest is anticipated to be strong. Should HYPE successfully hold above this cluster, it could provide the necessary springboard for a recovery attempt. However, a decisive breach below this level would weaken the bullish setup considerably, potentially exposing lower support areas. Beyond this specific confluence, market commentary has also identified the broader $58 region as an important near-term support level. A break below $58 would likely shift attention towards the $53-$50 area, where increased selling pressure could accelerate the decline.
On the upside, the most immediate challenge for Hyperliquid’s price is the overhead resistance band of $64-$68. This zone has emerged as a formidable technical barrier following HYPE’s retreat from its June peak. A recovery into this range would serve as a crucial test of whether buyers have managed to regain sufficient momentum to reverse the recent downtrend. A sustained breakout above $68, especially if supported by robust trading volume, would significantly strengthen the recovery structure. Such a move could then shift market attention towards the $72-$76 resistance band, which sits closer to the previous all-time high of $77. Overcoming these successive hurdles would be essential for HYPE to challenge and potentially surpass its prior peak.
Hyperliquid’s Expanding Ecosystem: Volume, Market Share, and Implications
The technical indicators are unfolding against a backdrop of compelling fundamental growth within Hyperliquid’s ecosystem. The platform processed an astounding $266 billion in monthly perpetual futures volume last month. This figure is not only impressive in absolute terms but also highlights Hyperliquid’s increasing competitive edge. Its volume relative to Binance, a titan in the centralized crypto exchange space, reached 16.52%. This remarkable increase from a negligible share in 2023 to over 15% by mid-2026 signifies a profound shift in the decentralized finance landscape.

This expansion underscores the growing maturity and appeal of decentralized exchanges (DEXs), particularly those specializing in derivatives. Hyperliquid’s Layer-1 blockchain, meticulously engineered for perpetual futures trading, allows it to offer a trading experience that can directly compete with centralized counterparts in terms of speed, cost, and liquidity. The implications of such sustained growth are multifaceted:
- Increased Protocol Revenue: Higher trading volumes translate directly into increased fees for the protocol, strengthening its financial health.
- Enhanced Token Economics: Robust protocol revenue can feed into the HYPE token’s utility and value proposition, potentially through buyback mechanisms, staking rewards, or governance power, thereby aligning the interests of token holders with the protocol’s success.
- Deepened Liquidity: Consistent high volume attracts more market makers and traders, further enhancing liquidity, which in turn reduces slippage and improves the trading experience, creating a positive feedback loop.
- Network Effects: As more traders and capital migrate to Hyperliquid, its network effects strengthen, making it an even more attractive venue for derivatives trading.
While growing trading activity doesn’t automatically guarantee an immediate appreciation in HYPE’s price, it certainly provides a strong fundamental underpinning. Sustained volumes and market share gains are crucial long-term drivers for any decentralized protocol, validating its product-market fit and solidifying its position within the competitive crypto landscape.
Mixed Technical Signals and the Search for Momentum Confirmation
Beyond specific price levels, a broader look at HYPE’s technical indicators reveals a mixed picture, reflecting a market currently in a consolidation phase rather than exhibiting a clear, singular trend. TradingView’s technical summary for HYPEUSDT has recently presented a broadly neutral outlook across major timeframes. Moving averages, often used to gauge trend direction and strength, have also provided conflicting signals depending on the timeframe and trading pair under consideration. Shorter-term averages may act as dynamic resistance during a pullback, while longer-term averages, such as the 100-day Exponential Moving Average (EMA), are being closely watched as potential areas of enduring support, especially given HYPE’s strong multi-month performance leading up to its June high. Holding above such major long-term moving averages is crucial for preserving the broader bullish market structure. Conversely, a sustained breakdown below these averages could increase the probability of a deeper retracement towards the $53-$50 region.
A caveat for traders is the varying availability of live indicator readings across different trading pairs and platforms. The source material notes limitations for certain HYPEUSDT pairs on platforms like KuCoin regarding real-time data for indicators such as RSI, MACD, and Stochastic. This highlights the importance for traders to consult multiple high-volume spot and perpetual futures markets to gain a comprehensive and accurate technical perspective, rather than relying on potentially incomplete data from a single source.
The correction from the June high has significantly altered HYPE’s momentum profile. The token is no longer trading at the heavily extended or overbought levels seen during its previous rally, suggesting that oscillators like the Relative Strength Index (RSI), Stochastic Oscillator, and Williams %R may have moved closer to neutral or even oversold territory. However, without confirmed live readings, it would be premature to label HYPE as technically oversold based solely on the recent price decline.
Traders are therefore looking for clear signals of a momentum shift to confirm a potential recovery. Key indicators to watch include:

- An RSI moving back above the 50 level, indicating increasing buying pressure.
- A positive turn in the Moving Average Convergence Divergence (MACD) histogram, signaling a shift from bearish to bullish momentum.
- A noticeable increase in trading volume accompanying any upward price movements, validating the strength of the rally.
- The emergence of a bullish divergence, where price makes a lower low while a momentum indicator makes a higher low, often foreshadowing a potential trend reversal.
Until such confirmatory signals emerge, the prevailing neutral technical picture suggests that HYPE will likely remain in its current consolidation phase, with price action largely dictated by its interaction with the established support and resistance zones.
HYPE Price Prediction: Key Levels to Watch and Broader Market Context
From a purely technical standpoint, the immediate future of HYPE hinges on its interaction with several critical price levels. The $58-$59 area stands out as an exceptionally important support zone, buttressed by the technical confluence identified by CryptoPatel and its proximity to recent price lows. Should buyers successfully defend this area, the first significant upside test will be the $64-$68 resistance zone. A confirmed breakout above $68, ideally backed by a surge in trading volume, could pave the way for a move towards the $72-$76 range, with the ultimate target being a retest of the previous all-time high around $77.
Conversely, a decisive break below the $58 support level would signal a weakening of the recovery setup. In such a scenario, the $53-$50 range would become the next crucial area for the HYPE price prediction, representing a deeper retracement that could test the conviction of long-term holders.
The key levels for traders to monitor can be summarized as follows:
- Immediate Support: $58-$59 (confluence of order block, FVG, 0.382 Fibonacci retracement)
- Next Downside Targets: $53-$50
- Immediate Resistance: $64-$68
- Next Upside Targets: $72-$76, followed by the all-time high at $77
Beyond these technical levels, broader crypto-market volatility remains a significant external factor. Movements in Bitcoin (BTC), macroeconomic trends, and evolving regulatory landscapes can all exert considerable influence on altcoins like HYPE. Furthermore, changes in derivatives activity on Hyperliquid itself, such as shifts in funding rates or open interest, can offer additional insights into market sentiment and potential price movements.
Conclusion: A Decision Point for Hyperliquid

Hyperliquid’s current market structure presents a complex yet closely watched setup. The $58-$59 region is solidifying its role as a critical support area, while the $64-$68 zone represents the primary resistance that bulls must overcome. A sustained breakout above $68, particularly if accompanied by robust trading volume and improving momentum indicators, would provide compelling evidence of a recovery towards $72-$76 and potentially a challenge to the $77 all-time high. Conversely, a failure to hold the $58-$59 support area would likely shift the technical outlook to a more bearish stance, bringing the $53-$50 region into sharper focus.
The fundamental backdrop for Hyperliquid remains comparatively strong, characterized by impressive growth in perpetual futures activity, a rising market share against centralized competitors, and a token model intrinsically linked to protocol revenue. However, these strong fundamentals do not automatically guarantee near-term price appreciation in the face of prevailing market corrections and profit-taking.
Ultimately, the HYPE price prediction remains highly dependent on the confirmation provided by both price action and market participation. Traders are advised to meticulously monitor trading volume, multi-timeframe momentum indicators, and broader crypto-market conditions before interpreting either a breakout or a breakdown as a confirmed shift in trend. The coming days and weeks will be crucial in determining whether Hyperliquid can leverage its fundamental strength to overcome technical resistance and resume its upward trajectory, or if it will require further consolidation before a sustained rally can materialize.