The global cryptocurrency landscape faced one of its most punishing tests between July 2025 and June 2026, navigating a punishing bear market defined by a historic 50% drawdown in total market capitalization. Despite a $2.1 trillion contraction and Bitcoin’s largest-ever dollar-value retreat—shedding $67,000 from peak to trough—worldwide on-chain economic activity proved remarkably resilient. According to the newly released seventh annual Chainalysis Geographies Report, the global crypto economy shrank by a modest 1.6%, registering $9.4 trillion in economic activity compared to $9.5 trillion during the previous 12-month period.
This resilience signals a structural maturation of the digital asset ecosystem. While historical market downturns were historically dictated by pure speculation, the 2026 contraction highlights a diversifying global utility base where stablecoins, peer-to-peer (P2P) transfers, and localized payment corridors function independently of shifting asset prices.

The Anatomy of the 2026 Bear Market: Chronology and Scale
The 12-month reporting period spanning July 1, 2025, to June 30, 2026, captured a dramatic financial arc for digital assets. Following a robust bull run that pushed Bitcoin to historic highs in late 2025, the market experienced a severe correction. Global cryptocurrency balances tracked on-chain plummeted from a peak of $0.86 trillion in September 2025 down to $0.44 trillion by June 2026.
Unlike the cascading corporate scandals and exchange collapses that triggered the severe 2022 bear market, the 2026 downturn was primarily driven by macroeconomic pressures and standard market cycles. Yet, the impact on liquidity was profound. A market trading at half its former valuation required participants to execute twice the volume of transactions to achieve the same economic throughput as previous years.
Despite these headwinds, overall economic value flows fell by only 1.6%. When compared to the 2023 bear market—which saw a 23% drop in value flows despite a much smaller $0.3 trillion decline in market cap—the 2026 data indicates that everyday users and institutional players relied on digital assets more heavily for functional use cases rather than purely speculative trading.

Grassroots Adoption Leaders: Brazil Claims the Top Spot
To accurately capture how different populations interact with digital assets, Chainalysis updated its adoption index methodology for 2026. The framework evaluates four core pillars: service inflows, domestic peer-to-peer cryptocurrency transactions, cross-border flows, and accumulated on-chain balances. By weighting raw values against purchasing power parity (PPP) and utilizing a geometric mean, the index rewards consistent performance across all categories rather than dominance in a single metric.
Leading the global index for 2026 is Brazil, which anchored a massive $252.5 billion domestic crypto economy. While Brazil did not rank first in any single sub-category, its consistent high-tier performance across services, balances, P2P transactions, and cross-border flows propelled it past the United States and emerging economic powerhouses.
The top 20 countries ranked by grassroots adoption in the 2026 report reflect a truly global distribution:

- Brazil
- United States of America
- Nigeria
- Japan
- Republic of Korea
- India
- Ukraine
- Thailand
- South Africa
- Canada
- Mexico
- China
- Germany
- Indonesia
- Australia
- Russian Federation
- United Kingdom
- Viet Nam
- Philippines
- Türkiye
Retail Resilience and Institutional Stability
A deeper examination of transaction sizes reveals contrasting behaviors between everyday consumers and large-scale entities during the downturn. Retail-level participation demonstrated extraordinary growth. Small-dollar inflows into services—specifically transfers under $100—surged by 78.4%, while transfers ranging from $100 to $1,000 increased by 58.6%. Although these retail volumes accounted for $273 billion of the broader $10.4 trillion landscape, the sharp increase indicates that everyday participants maintained their engagement throughout the bear market.
Concurrently, institutional-sized activity showed surprising fortitude. Transfers valued at $1 million or more declined by just 7.2% period-over-period. Given that the underlying assets were worth up to 50% less than during peak pricing periods, institutional desks successfully absorbed the valuation shock by scaling up transaction frequencies to maintain strategic liquidity.
The Stablecoin Boom and the Maturation of Payment Corridors
The defining narrative of the 2026 reporting period is the explosive expansion of stablecoins. Bolstered by emerging legislative frameworks such as the GENIUS Act in the United States, Europe’s Markets in Crypto-Assets (MiCA) regulation, and progressive policy actions across Japan, Hong Kong, Singapore, and the United Kingdom, stablecoins cemented their role as the global digital dollar.

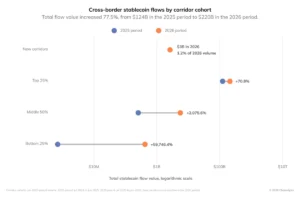
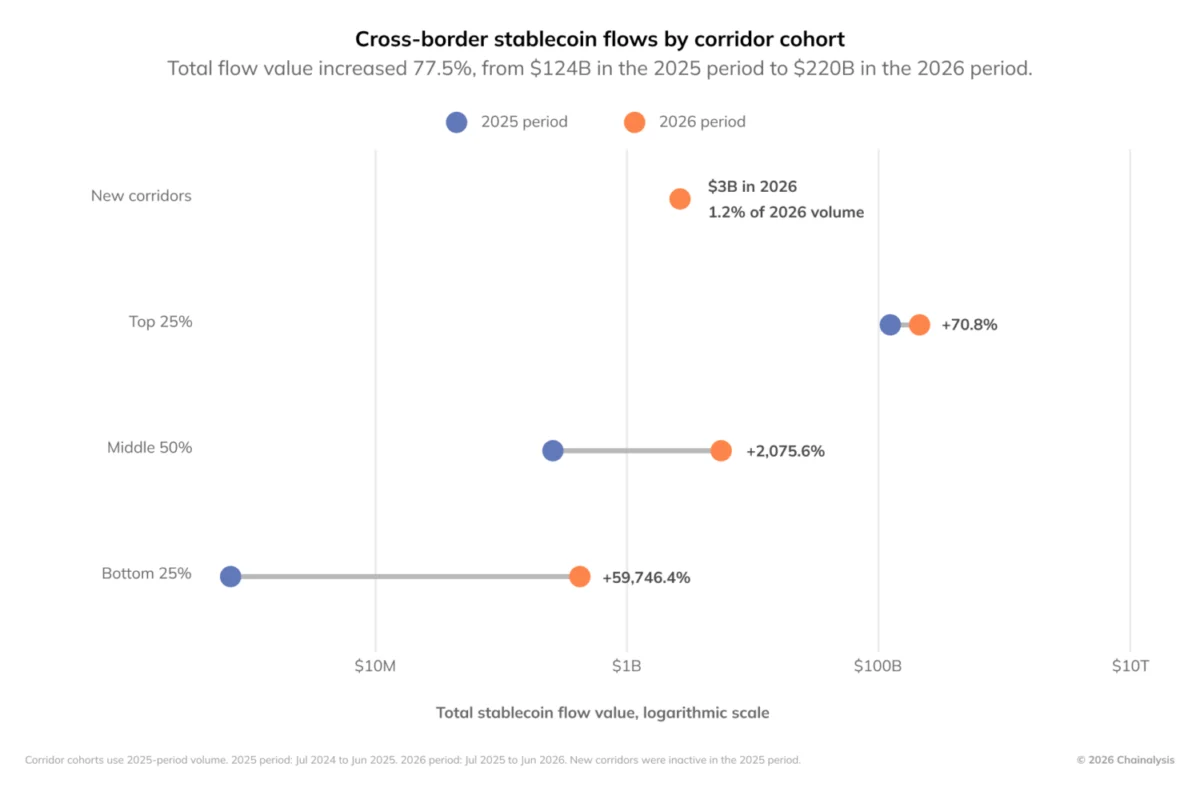
Conservative estimates of monthly cross-border stablecoin transactions more than doubled, climbing from $11 billion in January 2025 to $24 billion by June 2026. Total cross-border stablecoin transfers rose 77.5%, moving from $124.2 billion to $220.3 billion.
Industry analysts emphasize that these flows reflect functional trade rather than speculative trading. Philip Gradwell, Vice President of Economics at stablecoin issuer Tether, noted the distinct behavioral signature of these transactions.
"Activity has become consistent, routed through wallets in a steady rhythm rather than in bursts," Gradwell observed. "That is the signature of trade and business activity, not speculation. The real power of USDT is in the long tail, the parts of the economy that were priced out or shut out because traditional financial technology was too expensive or too restricted. USDT can serve them because it costs on average one cent per transaction, settles instantly, and needs nothing more than a phone."

Data corroborates this assessment: the average cross-border stablecoin transaction hovered around $3,000—a size ill-suited for institutional treasuries but perfectly aligned with cross-border payroll, merchant supply chain payments, and family remittances. Furthermore, liquidity expanded into previously dormant financial corridors. While top-tier corridors accounted for 96.1% of transfer value, the lower three quartiles of corridors experienced a surge from $0.26 billion to $8.66 billion, underscored by the establishment of 4,708 newly formed economic corridors collectively carrying $2.64 billion.
Peer-to-Peer Networks Outpace Centralized Services
While centralized exchanges and decentralized finance (DeFi) protocols experienced a slight 4.3% decline in inbound value—falling from $9.30 trillion to $8.90 trillion—peer-to-peer (P2P) networks experienced a massive rally. Domestic P2P transfers moving directly between personal wallets surged 302.9%, rising from $56.8 billion to $228.7 billion. P2P’s share of the combined market expanded across all eight global regions.
This divergence highlights a structural bifurcation in the crypto economy. Traditional exchange-based trading remains highly sensitive to asset prices and market sentiment. Conversely, P2P networks have transformed primarily into stablecoin rails. By June 2026, P2P transactions were composed of 96% stablecoins.

A parallel trend emerged in on-chain balances. While volatile assets experienced severe drawdowns, stablecoin balances remained remarkably stable, holding between $98 billion and $109 billion throughout the nine-month market correction. Because stablecoins are pegged to the fiat dollar, their relative market share expanded to 22.5% of all global crypto balances by June 2026 simply by retaining their purchasing power while surrounding assets depreciated.
Fact-Based Analysis of Implications
The 2026 Geographies Report illustrates a profound paradigm shift: cryptocurrency is successfully decoupling its core utility from speculative price cycles. In the Global South and emerging economies, stablecoins and P2P networks serve as vital infrastructure for hedging against local currency inflation, facilitating cross-border trade, and banking the unbanked. In Western capital markets, digital assets are increasingly treated as programmable technology infrastructure designed to upgrade legacy financial settlement systems.
As regulatory clarity solidifies across major global jurisdictions, the integration of blockchain-based rails into traditional commerce appears irreversible. The ability of the global crypto economy to absorb a $2.1 trillion market capitalization contraction while maintaining nearly flat economic throughput demonstrates that decentralized value transfer has transitioned from an experimental financial subculture into an indispensable component of modern global finance.