The global cryptocurrency landscape over the past year has been defined by extreme market volatility, historic drawdowns, and a fundamental shift in how digital assets are utilized across diverse global economies. According to the latest comprehensive data from the Chainalysis Geographies report covering the period from July 1, 2025, to June 30, 2026, the global crypto economy exhibited remarkable structural durability. Even as the broader market endured its most severe bear market since the cascading failures of 2022—featuring a staggering 50% contraction in total market capitalization that wiped out $2.1 trillion in value—global on-chain economic activity shrank by a modest 1.6%.
This resilience starkly contrasts with previous market downturns. While Bitcoin climbed to unprecedented all-time highs before recording its largest-ever dollar-value retreat—shedding $67,000 from peak to trough—the underlying economic utility of digital assets prevented a catastrophic collapse in transaction volumes. Total global economic activity across service inflows, domestic peer-to-peer (P2P) trading, and cross-border transfers reached $9.4 trillion for the 12 months ending June 30, 2026, dropping only slightly from $9.5 trillion in the preceding period. Observers note that this muted contraction proves digital assets are increasingly relied upon for real-world economic functions rather than purely speculative investment.

A Chronology of Volatility: The 2025-2026 Market Cycle
The period analyzed by the report marks one of the most tumultuous chapters in cryptocurrency history. The timeline began with a continuation of bullish momentum, pushing major tokens like Bitcoin to historic peaks by mid-2025. However, macroeconomic headwinds, shifting regulatory landscapes, and tightening global liquidity triggered a sharp market reversal.
By September 2025, global measured balances across wallets and centralized services peaked at $0.86 trillion before embarking on a relentless nine-month drawdown. As prices plummeted, overall crypto balances sank to $0.44 trillion by June 2026. Yet, within this downward spiral, distinct behavioral patterns emerged. While speculative trading volumes contracted in tandem with asset prices, transactional utility—particularly regarding stablecoins and grassroots peer-to-peer transfers—accelerated significantly, buffering the global network against deeper economic decay.
Shifting Demographics: Retail Persistence and Institutional Resilience
An examination of transaction sizes reveals distinct trends among different market participants during the 2025-2026 bear market. Retail-level users demonstrated an extraordinary appetite for continued engagement despite contracting portfolio values. Small-dollar inflows into cryptocurrency services experienced sharp growth: transfers under $100 surged by 78.4%, while transactions ranging from $100 to $1,000 grew by 58.6%. Although these retail segments accounted for a modest $273 billion of the nearly $10 trillion in aggregate activity, their upward trajectory underscores persistent grassroots adoption.

At the other end of the spectrum, institutional-sized transfers—defined as transactions exceeding $1 million—proved remarkably resilient. Despite holding assets that had lost up to half their nominal dollar value, large-scale participants kept their withdrawal and transfer activities steady, with multi-million dollar transfers dropping by a mere 7.2%. Market analysts point out that because asset valuations halved, institutional players had to move twice the volume of tokens to achieve the same economic throughput, effectively neutralizing the expected contraction in capital movement.
The Rise of Stablecoins and Cross-Border Corridors
Perhaps the most significant structural development during the 2025-2026 reporting period was the explosive growth of stablecoins. Bolstered by emerging regulatory frameworks across major global jurisdictions—including the GENIUS Act in the United States, MiCA in the European Union, and proactive regulatory steps in Japan, Hong Kong, Singapore, and the United Kingdom—stablecoins established themselves as the financial backbone of the digital asset ecosystem.
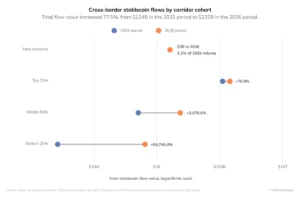
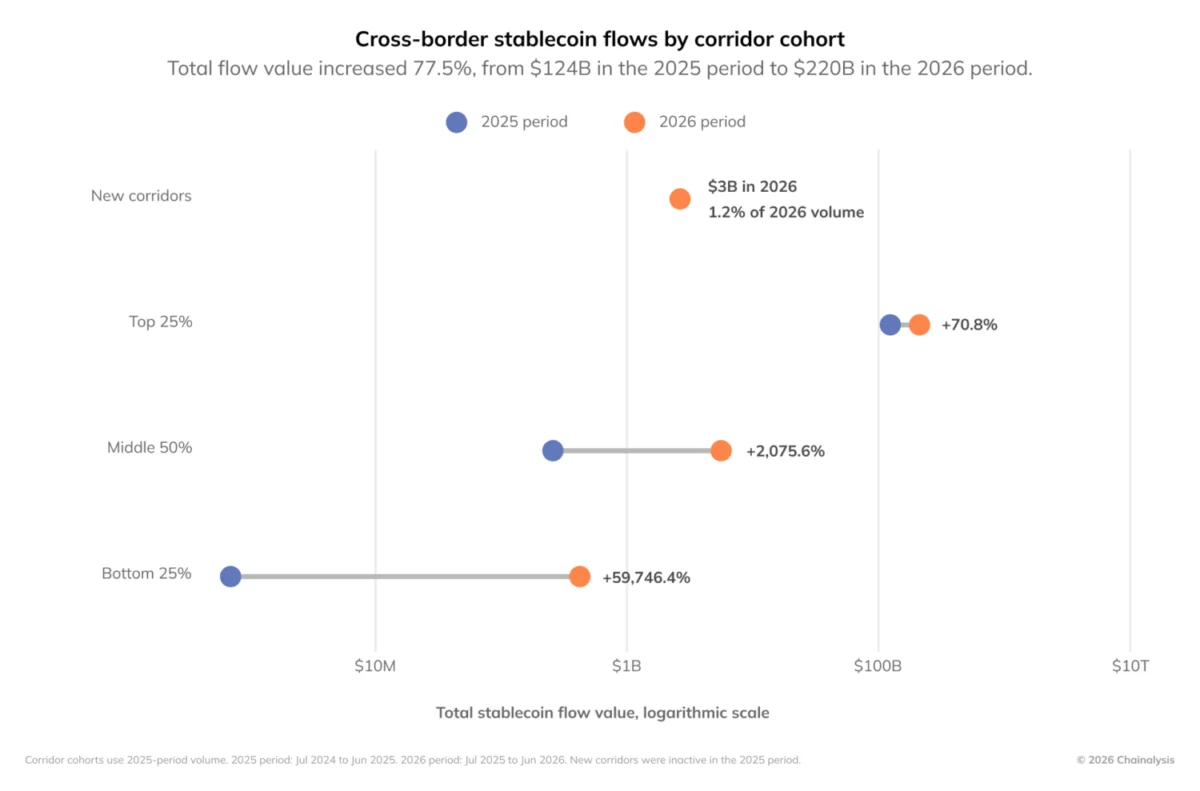
Conservative estimates indicate that monthly cross-border stablecoin transactions more than doubled, climbing from $11 billion in January 2025 to $24 billion by June 2026. Total cross-border stablecoin transfers over the 12-month period surged by 77.5%, rising from $124.2 billion to $220.3 billion. Crucially, these transfers averaged roughly $3,000, pointing away from institutional trading desks and toward everyday business payments, supply chain settlements, and family remittances.

Philip Gradwell, Vice President of Economics at Tether, highlighted the structural shift in transactional behavior: "Activity has become consistent, routed through wallets in a steady rhythm rather than in bursts. That is the signature of trade and business activity, not speculation." Gradwell added that assets like USDT have empowered marginalized economic sectors, noting that lower-income populations and small business owners rely on stablecoins because they "cost on average one cent per transaction, settle instantly, and need nothing more than a phone."
Furthermore, trade corridors utilizing stablecoins expanded rapidly. The bottom three quartiles of global transaction corridors—traditionally starved of efficient financial technology—saw cumulative volumes jump from $0.26 billion in previous periods to $8.66 billion. The network tracked 4,708 newly established corridors generating $2.64 billion in volume, demonstrating that stablecoins are successfully penetrating developing and underbanked regions.
Peer-to-Peer Networks Outpace Centralized Services
The bear market also triggered a dramatic divergence between centralized crypto services and decentralized peer-to-peer (P2P) networks. While value flowing into exchanges, DeFi protocols, and other formal services declined by 4.3% to $8.90 trillion, domestic peer-to-peer transactions between personal wallets skyrocketed by 302.9%, surging from $56.8 billion to $228.7 billion. P2P’s share of total combined activity quadrupled from 0.6% to 2.5%, registering growth across all eight global regions analyzed in the report.

This phenomenon highlights a core systemic difference: centralized exchange inflows are highly sensitive to asset prices and speculative sentiment, whereas P2P networks have evolved into nearly pure stablecoin settlement layers. By the close of the period, P2P transactions were composed of 96% stablecoins, shielding them from the price volatility that plagued native cryptocurrencies like Bitcoin and Ethereum.
Brazil Leads Global Grassroots Adoption
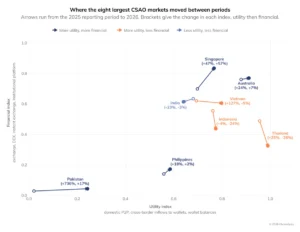
To accurately capture these shifting dynamics, the seventh annual Chainalysis Geographies report introduced a revised adoption methodology. The updated framework evaluates countries based on four key sub-indexes: service inflows, domestic peer-to-peer transactions, cross-border transfers, and on-chain asset balances. These raw metrics are adjusted using purchasing power parity and weighted against GDP per capita via web traffic analytics, ensuring equitable comparisons across diverse global economies.
Ranking 117 countries, the index revealed that Brazil has captured the top global spot for grassroots cryptocurrency adoption. Although Brazil did not claim the number one ranking in any single individual subcategory, its consistent, high-volume performance across all four vectors outpaced historically dominant markets like the United States.

The Top 20 countries by overall grassroots cryptocurrency adoption are:
- Brazil
- United States of America
- Nigeria
- Japan
- Republic of Korea
- India
- Ukraine
- Thailand
- South Africa
- Canada
- Mexico
- China
- Germany
- Indonesia
- Australia
- Russian Federation
- United Kingdom of Great Britain and Northern Ireland
- Viet Nam
- Philippines
- Türkiye
Implications and Future Outlook
The 2025-2026 market cycle offers a vital proof of concept for the digital asset industry. Despite the severe monetary contraction and macroeconomic headwinds that characterized the period, cryptocurrency did not contract in real-world utility. Instead, the market underwent a natural stratification: speculative investment retreated in alignment with falling valuations, while foundational financial utilities—anchored by stablecoins, cross-border remittance corridors, and peer-to-peer networks—achieved record-breaking adoption.
As regulatory clarity continues to solidify across Western and Asian financial hubs, the integration of blockchain rails into traditional economic infrastructure appears increasingly inevitable. The ability of the global crypto economy to absorb a $2.1 trillion valuation shock while maintaining nearly flat aggregate economic activity signals that digital assets are evolving from a speculative asset class into an indispensable alternative financial system for millions worldwide.