The global cryptocurrency landscape over the 2025–2026 reporting period faced one of the most volatile and severe bear markets in its brief history, yet underlying economic activity proved remarkably resilient. According to the seventh annual Geographies report published by blockchain intelligence firm Chainalysis, the global crypto economy experienced only a marginal contraction of 1.6% between July 1, 2025, and June 30, 2026. This stability occurred despite a staggering 50% drawdown in total market capitalization, which wiped out $2.1 trillion from the ecosystem.
While Western capital allocators increasingly view tokenized assets as a high-tech financial upgrade, and everyday investors treat cryptocurrencies as alternative portfolio holdings, low-wage workers and businesses in the Global South have embraced digital assets—specifically stablecoins—as absolute economic lifelines. These divergent identities have created a multi-layered global movement. As a result, total economic activity across service inflows, domestic peer-to-peer (P2P) transfers, and cross-border movements reached $9.4 trillion during the 2026 period, dipping only slightly from $9.5 trillion in the previous 12-month window.
Chronology and Market Volatility of the 2025–2026 Cycle

To understand the scale of the 2026 bear market, analysts must look back at the dramatic trajectory of digital asset prices. The monitoring period, spanning from July 1, 2025, to June 30, 2026, began with soaring optimism. Early in the cycle, Bitcoin shattered previous valuation ceilings to reach a historic all-time high. However, this peak was rapidly followed by the largest dollar-value retreat in the cryptocurrency’s history. From peak to trough, Bitcoin shed $67,000 in value, dragging the broader digital asset market into a punishing 50% capitalization drawdown.
This contraction eclipsed the psychological scars of 2022—a year defined by cascading corporate failures, bankruptcies, and industry-wide scandals. Historically, bear markets of this magnitude trigger catastrophic drops in global transaction volumes. For instance, during the 2023 downturn, value flows plummeted by 23% (equating to a $1.2 trillion drop) despite a relatively minor $300 billion contraction in overall market capitalization.
In stark contrast, the 2026 bear market saw value flows contract by a mere 1.6% ($100 billion). Analysts attribute this muted decline to the fundamental evolution of cryptocurrency utility. Rather than being utilized purely for speculative investment, digital assets have deeply integrated into everyday commercial transactions, international trade, and currency hedging strategies. Because utility-driven transfers are insulated from sentiment-driven speculation, they continued to flow steadily regardless of market prices.
Granular Data Analysis: Retail and Institutional Resilience

A closer examination of transaction sizes reveals fascinating shifts in user behavior throughout the 2026 period. Small-dollar retail participation exhibited remarkable strength despite shrinking portfolio balances. Inflows under $100 surged by 78.4%, while transfers ranging from $100 to $1,000 grew by 58.6%. Although retail-level inflows accounted for $273 billion of the nearly $10 trillion in overall economic activity, these figures demonstrate that everyday users maintained persistent engagement with crypto platforms through the downturn.
At the other end of the spectrum, institutional-sized transfers—defined as transactions of $1 million or more—proved exceptionally resilient. Large-scale institutional flows experienced a decline of just 7.2% period-over-period. Given that institutional portfolios had lost up to 50% of their fiat-denominated value due to the price crash, maintaining this volume required institutional players to execute roughly double the transaction volume just to match previous nominal benchmarks. This sustained activity underscores the institutionalization of the asset class, with corporate treasuries, funds, and market makers treating digital infrastructure as a permanent fixture of modern finance.
The Explosive Rise of Cross-Border Stablecoin Corridors
Perhaps the most defining trend of the 2026 period was the explosive growth of stablecoins, which served as a primary anchor against macroeconomic uncertainty. Emerging regulatory frameworks—such as the GENIUS Act in the United States, the Markets in Crypto-Assets (MiCA) regulation in the European Union, and progressive policy actions in Japan, Hong Kong, Singapore, and the United Kingdom—have provided clearer guardrails, accelerating institutional and retail confidence.

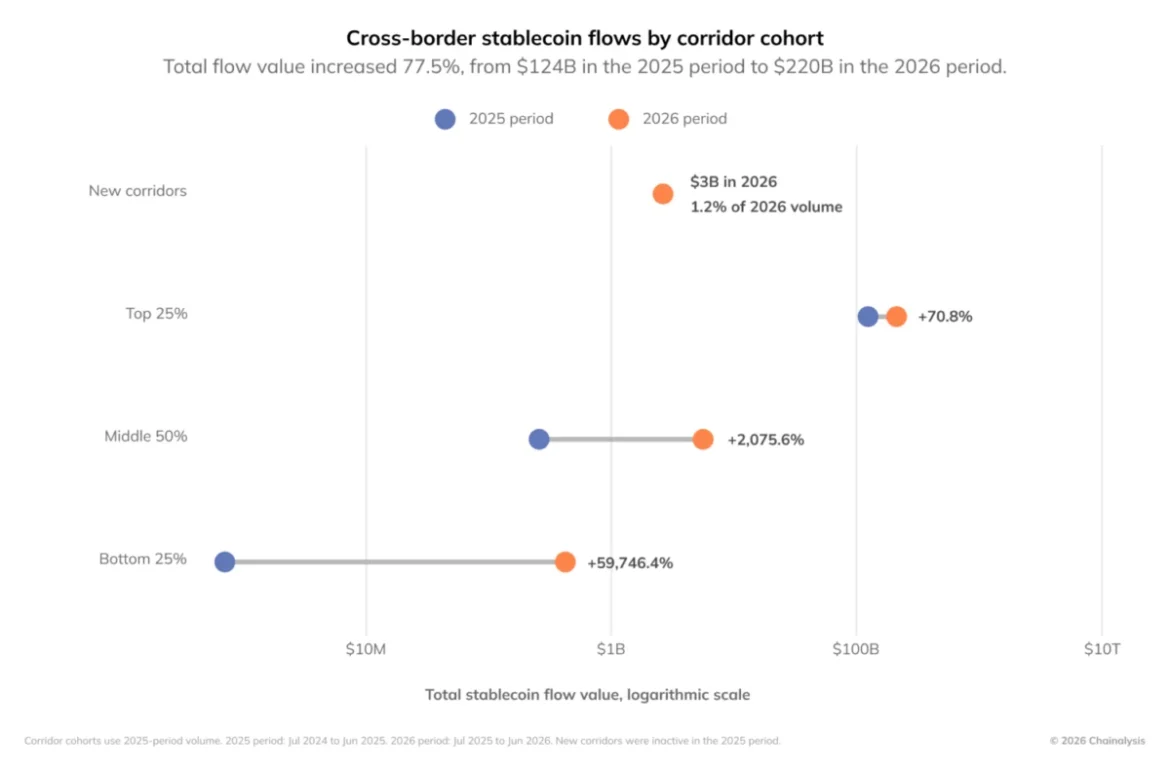
Conservative estimates indicate that monthly cross-border stablecoin volume more than doubled, climbing from $11 billion in January 2025 to $24 billion by June 2026. Across the entire 12-month period, cross-border stablecoin transfers surged by 77.5%, rising from $124.2 billion to $220.3 billion. Crucially, these transfers averaged approximately $3,000, pointing away from institutional trading desks and toward everyday commercial utility, such as cross-border supplier payments, remittances to family members, and capital flight from unstable domestic fiat currencies.
Philip Gradwell, Vice President of Economics at Tether, highlighted the structural shift in market behavior during the downturn. "Activity has become consistent, routed through wallets in a steady rhythm rather than in bursts," Gradwell noted. "That is the signature of trade and business activity, not speculation."
Furthermore, stablecoins expanded deeply into the "long tail" of global commerce, opening up new trade corridors that were previously underserved by traditional banking rails. The bottom three quartiles of global economic corridors—which historically carried just $0.26 billion—surged to $8.66 billion during the 2026 period. Analysts tracked 4,708 newly formed corridors cumulatively carrying $2.64 billion, heavily anchored by USDT due to its instant settlement times, near-zero transaction costs (averaging roughly one cent), and accessibility via basic mobile devices.
Peer-to-Peer Networks Outpace Centralized Services

While centralized exchanges and decentralized finance (DeFi) protocols experienced a slight contraction, peer-to-peer (P2P) activity experienced an unprecedented global rally. Total value flowing into formal services fell by 4.3%, dropping from $9.30 trillion to $8.90 trillion. Conversely, direct, domestic P2P transactions between personal wallets skyrocketed by 302.9%, surging from $56.8 billion to $228.7 billion. Consequently, P2P’s share of the combined economy quadrupled from 0.6% to 2.5%, registering growth across all eight monitored geographic regions.
This divergence highlights a fundamental bifurcation in the crypto economy: speculative trading channels contract alongside falling prices, whereas utility-driven payment rails expand to meet local economic demands. By June 2026, domestic P2P transactions were composed of 96% stablecoins, proving that the payments sector largely decoupled from the broader market’s bearish sentiment.
Regional Divergence and Grassroots Adoption Rankings
The Chainalysis report emphasizes that global crypto adoption is deeply regionalized. While North American and European markets leaned heavily into institutional adoption and asset tokenization, emerging economies in Latin America and Sub-Saharan Africa drove phenomenal grassroots growth. Latin America bucked the global trend entirely, expanding its crypto economy by 9.8% period-over-period, propelled by widespread stablecoin adoption as a hedge against chronic currency devaluation. Meanwhile, Sub-Saharan Africa led the world in overall growth percentage, fueled by exceptionally high rates of P2P activity.

To capture these complex dynamics accurately, Chainalysis introduced a revamped methodology for its seventh annual report. The newly designed Grassroots Adoption Index evaluates 117 countries based on four key pillars: service flows, domestic P2P transaction volume, cross-border transfers, and on-chain asset balances. To prevent wealthy nations from skewing the data purely through sheer capital volume, raw metrics are weighted using purchasing power parity (PPP) and GDP per capita.
Ranking at the pinnacle of the global index for grassroots adoption is Brazil. While Brazil did not secure the number-one spot in any single sub-category, its consistent, high-volume performance across all four metrics—amassing a $252.5 billion crypto economy—outpaced more established financial hubs like the United States.
The top 20 countries ranked by grassroots crypto adoption for the 2026 period are as follows:
- Brazil
- United States of America
- Nigeria
- Japan
- Republic of Korea
- India
- Ukraine
- Thailand
- South Africa
- Canada
- Mexico
- China
- Germany
- Indonesia
- Australia
- Russian Federation
- United Kingdom of Great Britain and Northern Ireland
- Viet Nam
- Philippines
- Türkiye
Implications and Future Outlook

The findings of the 2026 Geographies report signal a maturing digital asset ecosystem. Although speculative market cycles continue to dictate token valuations and headline-grabbing price swings, the underlying infrastructure of the crypto economy has institutionalized. Stablecoins have firmly established themselves as a trusted monetary anchor, maintaining between $98 billion and $109 billion in on-chain balances throughout the nine-month bear market and driving their relative share of total crypto balances to 22.5%.
As regulatory clarity solidifies across major global jurisdictions, the friction between traditional finance and decentralized networks continues to dissolve. For policymakers, financial institutions, and market participants, the 2025–2026 bear market offered a stress test of unprecedented proportions—one that digital assets passed by demonstrating that utility, speed, and financial inclusion can prevail even in the depths of a multi-trillion-dollar contraction.