The cryptocurrency market is witnessing a profound psychological shift regarding its premier asset, Bitcoin. Gone is the unbridled euphoria that characterized earlier bullish phases of the current cycle. In its place, a familiar shroud of market pessimism and skepticism has descended upon traders and investors. As prices retreat from previous all-time highs, Bitcoin has officially entered what market analysts identify as a classic Dollar-Cost Averaging (DCA) accumulation zone. This specific region historically materializes precisely when retail sentiment touches multi-month lows, quietly laying the groundwork for long-term structural recoveries. While short-term macroeconomic pressures and shifting exchange-traded fund (ETF) flows continue to inject volatility into the ecosystem, historical precedents suggest that these periods of maximum fear often precede the most significant structural bull runs in Bitcoin’s financial history.
An Examination of Historical Market Cycles and Past Precedents
To understand the gravity of Bitcoin’s current positioning, market historians must examine how previous macroeconomic and crypto-native cycles unfolded. The cyclical nature of Bitcoin is well-documented, typically defined by multi-year halving events, liquidity expansions, and subsequent deleveraging periods.
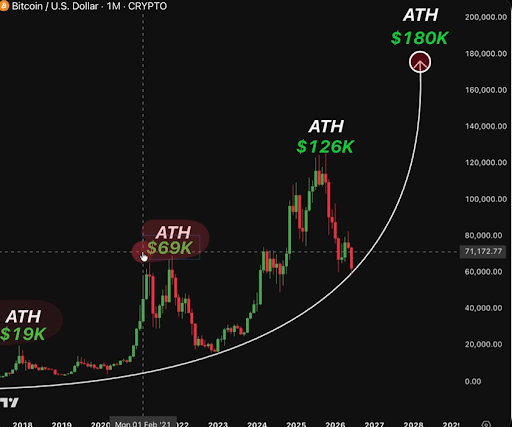
Looking back at the 2017–2019 market cycle, Bitcoin captured global headlines by surging to an all-time high of approximately $19,000. However, the subsequent crypto winter was brutal, dragging the leading cryptocurrency down by more than 83% from its peak. During the depths of the 2019 bear market, Bitcoin entered a depressed accumulation channel. At the time, widespread media outlets and retail investors declared the asset dead, yet this exact DCA zone served as the springboard for the explosive rally that ultimately carried Bitcoin to its 2021 peak of roughly $69,000.

A structurally identical pattern emerged during the 2021–2022 market cycle. Following the 2021 highs, the ecosystem endured a cascade of institutional and centralized platform failures, culminating in the collapse of the FTX exchange in November 2022. Forced liquidations drove Bitcoin down to a cycle low of approximately $15,500. Despite the profound fear dominating the sentiment indexes, resilient investors accumulated aggressively within that depressed corridor. This strategic positioning rewarded patient market participants with a staggering rally of nearly 600%, pushing prices past the $100,000 threshold and ultimately establishing a new milestone above $126,000 in October 2025.
Current Market Structure and Price Action Analysis
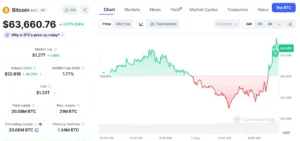
At the time of writing, Bitcoin is changing hands around $62,800, operating precisely near the curved multi-month moving support lines visible on long-term monthly charts. This valuation represents a stark retreat from its record-breaking heights, yet it honors the structural parameters that defined the 2019 and 2022 accumulation zones.
Prominent crypto analyst Ardizor recently highlighted this repeating structural phenomenon on social media platform X, emphasizing that the current price action mirrors the exact psychological and technical setup observed prior to past major recoveries. The recurring blueprint remains consistent: a wave of market exhaustion sets in, prices consolidate within a long-term DCA band, despair dominates public discourse, and a subsequent supply shock propels the asset toward unprecedented valuations.
Nevertheless, navigating the current price landscape requires a clear-eyed assessment of opposing market forces. Unlike previous quiet accumulation phases, the modern Bitcoin market is deeply intertwined with traditional financial plumbing, institutional derivatives, and spot exchange-traded funds.

On-Chain Metrics, ETF Flows, and Capitulation Signals
While the long-term technical structure supports the thesis of a healthy accumulation zone, on-chain analytics reveal a complex tug-of-war between bulls and bears. Recent data points indicate that Bitcoin’s Realized Cap—a metric tracking the aggregate value of all coins based on the price at which they last moved on-chain—has experienced a contraction of roughly $12 billion from its mid-May peak. This reduction signals that capital is actively leaving the network or that older coins are being redistributed at a loss during ongoing consolidation.
Furthermore, assessments of Bitcoin’s Profit and Loss (PnL) Index suggest that the asset may not have definitively locked in its absolute cyclical bottom. Data models tracking aggregate market profitability indicate that Bitcoin is currently navigating a protracted transition phase rather than a definitive capitulation floor.
However, market historians argue that this lingering uncertainty does not invalidate the validity of the current DCA zone. In fact, past accumulation phases in 2019 and 2022 were never defined by serene, orderly market conditions. Instead, they were characterized by thin liquidity, widespread skepticism, and persistent calls from analysts predicting that deeper lows were still months away. The presence of ongoing bearish pressures—such as fluctuating spot ETF net inflows and macro-driven risk aversion—often serves to shake out leveraged retail participants, leaving committed long-term holders in control of the circulating supply.
Broader Financial Implications and Institutional Perspectives
The maturation of Bitcoin as an institutional-grade asset class has fundamentally altered how accumulation phases play out. Wall Street institutions, corporate treasuries, and sovereign entities now view deep price corrections through a different lens than the retail-dominated markets of past decades. Coinbase executives and other institutional market participants have frequently characterized these cyclical downturns as an institutional discount window, where legacy financial players quietly build multi-million-dollar positions away from the glare of daily retail hype.
The implications of this institutional integration are twofold. On one hand, institutional participation introduces greater correlation with macroeconomic indicators, such as Federal Reserve interest rate decisions, Treasury yields, and global liquidity indexes. When traditional markets experience a liquidity crunch, Bitcoin frequently faces short-term downward pressure, as seen in recent derivative liquidations and subdued ETF inflows. On the other hand, the sheer scale of institutional capital provides a thicker structural floor compared to previous retail-driven cycles.
As Bitcoin hovers near the $62,800 region, the overarching question facing the industry is whether the asset can maintain this long-term support structure long enough for macroeconomic conditions to turn favorable. If historical cycles offer any guidance, the transition from fear to accumulation is rarely comfortable. For seasoned investors utilizing dollar-cost averaging strategies, the current market climate presents a textbook risk-reward asymmetry, echoing the very conditions that preceded previous historic rallies. Whether the market requires a prolonged consolidation period or is quietly preparing for a sudden supply squeeze, Bitcoin remains anchored to the cyclical rhythms that have defined its existence for over a decade.