
The market structure for the world’s leading cryptocurrency, Bitcoin (BTC), has experienced a definitive shift away from the euphoric highs witnessed in previous quarters, landing firmly within what market analysts identify as a classic dollar-cost averaging (DCA) accumulation zone. Trading near $62,800, BTC is currently hovering above crucial long-term curved support levels on monthly timeframes, mirroring cyclical patterns that have historically preceded monumental structural rallies. While short-term macroeconomic headwinds, shifting exchange-traded fund (ETF) flows, and declining on-chain metrics introduce notable bearish friction, seasoned market observers note that these phases of profound fear and capitulation have routinely laid the groundwork for the asset’s most robust multi-year recoveries.
An Overview of the Current Market Landscape
Bitcoin’s current valuation reflects a stark cooling off from the heights of late 2025, when the asset reached an all-time high above $126,000 following a nearly 600% surge from the depths of the 2022 bear market. Market participants are no longer operating in an environment of guaranteed upward momentum; instead, sentiment indices point toward mounting caution, fatigue, and a resurgence of the familiar narrative that "Bitcoin is dead."
However, crypto analysts emphasize that this psychological fatigue is a core characteristic of historical DCA zones. These regions are defined not by high-volume retail frenzy, but by quiet, systematic accumulation from long-term holders, institutional entities, and patient investors who view depressed or consolidating price action as an asymmetric risk-reward opportunity. Despite ongoing turbulence, the foundational technical structure on higher timeframes remains intact, keeping the debate open as to whether the current price level represents the ultimate launchpad for the next macro cycle or merely a temporary waypoint in a longer consolidation phase.
Historical Chronology and Cyclical Parallels

To understand the significance of Bitcoin’s current positioning, market historians look back at comparable structural setups from past cycles. The anatomy of a Bitcoin macro cycle frequently involves an explosive peak, a severe drawdown driven by systemic fear or macro shocks, a prolonged period of consolidation within a DCA zone, and a subsequent parabolic breakout to unprecedented price discovery.
In 2017, Bitcoin reached a watershed cycle peak of approximately $19,000 before succumbing to a grueling bear market that dragged prices down by over 83%. Throughout much of 2019, BTC languished in a depressed accumulation corridor. To the broader public and mainstream media, the asset appeared to have lost its secular momentum. Yet, this exact DCA zone formed the structural foundation for the 2020–2021 bull run, which ultimately culminated in an all-time high of roughly $69,000.
A structurally identical pattern unfolded during the 2021–2022 cycle. Following the November 2022 collapse of the FTX cryptocurrency exchange—an event that induced widespread forced liquidation and capitulation—Bitcoin’s price plummeted to a cycle low of approximately $15,500. Once again, retail capitulation collided with institutional accumulation. Those who utilized the DCA strategy during the depths of the FTX fallout were positioned to ride the subsequent multi-year recovery, which broke past previous boundaries and achieved new records above $126,000 in late 2025.
Supporting Data, On-Chain Metrics, and Technical Indicators
Current technical charts on the daily and monthly timeframes place Bitcoin trading at approximately $62,728 to $62,800. This places the asset directly on top of the historical curved support line observed in previous cycle transitions. Nevertheless, a comprehensive examination of on-chain data reveals a nuanced and complex market environment characterized by conflicting signals between bulls and bears.
One of the most notable bearish pressures comes from the behavior of Bitcoin’s Realized Cap—a metric that values each UTXO (Unspent Transaction Output) at the price it last moved on-chain, effectively reflecting the aggregate amount of capital hard-coded into the network. Recent data indicates that Bitcoin’s Realized Cap has declined by roughly $12 billion from its mid-May peak. This capital outflow suggests that some long-term investors have been distributing holdings or realizing losses, contributing to short-term supply overhang.

Furthermore, indicators such as the Profit and Loss (PnL) Index—which synthesizes multiple network-wide profitability metrics—suggest that Bitcoin may not have reached its definitive cyclical bottom quite yet. According to recent on-chain analyses, the market is currently navigating a protracted "transition phase." Unlike the instantaneous, V-shaped bottoms of past flash crashes, structural bottoms during maturing market cycles often require extended lateral consolidation to flush out remaining leveraged positions and weak hands.
Institutional Reactions and Market Perspectives
Institutional players, regulatory bodies, and macroeconomic analysts hold diverging views on how these on-chain dynamics will resolve over the coming quarters. Representatives from major financial institutions and digital asset custodians have increasingly framed current price dips as discounted accumulation opportunities for sovereign wealth funds, corporate treasuries, and newly established spot Bitcoin exchange-traded funds (ETFs).
Coinbase executives and other industry leaders have frequently noted that institutional adoption creates a structural floor that differs significantly from the retail-driven cycles of 2017 and 2021. Even during periods of macroeconomic tightening or shifting regulatory clarity, institutional capital allocation strategies typically rely on disciplined dollar-cost averaging rather than emotional swing trading. This institutional backing helps explain why current price corrections, while sharp, have respected macro technical boundaries rather than descending into unstructured free-falls.
Conversely, risk-off sentiment across traditional global equity markets, persistent interest rate uncertainties, and fluctuating inflows into spot Bitcoin ETFs have introduced headwinds. When ETF outflows accelerate, the immediate spot market absorbs additional sell pressure, dampening the velocity of bullish breakouts and prolonging the time spent within accumulation corridors.
Broader Economic Impact and Market Implications
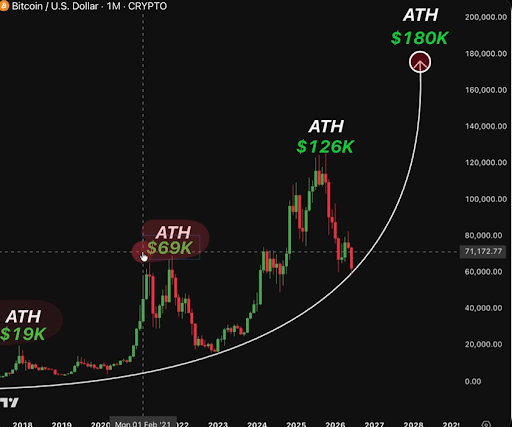
The broader implications of Bitcoin settling into a historical DCA zone extend far beyond speculative crypto trading circles. As digital assets become increasingly integrated into traditional portfolio construction, the behavior of BTC during macro transition phases offers vital insights into broader global liquidity cycles.
If historical precedent holds, the current phase of low sentiment and high skepticism will eventually give way to structural supply compression. As more coins are absorbed by long-term holders and institutional vaults, the available liquid supply on centralized exchanges continues to dwindle. When demand inevitably returns—whether catalyzed by monetary policy pivots, global liquidity expansion, or structural adoption milestones—the resulting supply shock can trigger rapid price appreciation.
Conversely, if macroeconomic conditions worsen significantly or if sustained ETF outflows drive the Realized Cap down further, Bitcoin could test deeper support tiers before finding a true macro floor. In either scenario, market participants are reminded of the high volatility inherent in digital asset investing, where the greatest long-term opportunities are almost invariably forged in environments characterized by widespread fear, doubt, and journalistic declarations of the asset’s demise.
Conclusion and Outlook
Bitcoin stands at a critical juncture in its multi-year market lifecycle. Trading near $62,800, the leading cryptocurrency is testing the limits of the same historical DCA accumulation zone that preceded the dramatic recoveries of 2019 and 2022. While declining Realized Cap figures, ongoing transition phases in PnL indexes, and shifting ETF flows indicate that bearish pressures remain active, the core structural setup remains aligned with past pre-rally phases. As the market digests these competing forces, the coming months will determine whether patient accumulation in the face of fear will once again pave the way for a new era of price discovery.