The latest technical assessment of the Bitcoin (BTC/JPY) market, conducted via the proprietary Matrix Method as of July 24, 2026, has returned a comprehensive score of 4.0 on a 5.0 scale, signaling a robust bullish shift in market sentiment. This evaluation, provided by Rakuten Wallet, suggests that the digital asset has successfully navigated a period of consolidation—metaphorically described as the "rainy season"—and is now positioned for a potential "summer rally." The analysis utilizes a six-pillar technical framework designed to eliminate subjective bias and provide a quantitative view of price action, momentum, and volatility.
The current score of 4.0 remains unchanged from the previous reporting period, indicating sustained strength despite minor localized volatility. Analysts point to the successful breach of the 10.75 million JPY threshold as a pivotal moment, effectively completing a double-bottom chart pattern. While the market has not yet "cleared" all overhead resistance with absolute certainty, the technical indicators across the board suggest that the floor is firm and the trajectory is increasingly upward-leaning.
The Matrix Method: A Multi-Factor Analytical Framework
To achieve an objective evaluation of the Bitcoin market, the Matrix Method evaluates six distinct technical indicators, assigning each a score from 1 (Strongly Bearish) to 5 (Strongly Bullish). These indicators include:
- Pattern Analysis: Focusing on structural formations like double bottoms, head and shoulders, and trendlines.
- Moving Averages (MA): Specifically the 9-day (short-term) and 25-day (medium-term) averages, alongside the 200-day (long-term) trend.
- Ichimoku Kinko Hyo: A comprehensive Japanese indicator that assesses support, resistance, and momentum through the "Cloud" (Kumo).
- Bollinger Bands: A measure of volatility and trend exhaustion.
- MACD (Moving Average Convergence Divergence): A momentum oscillator that tracks the relationship between two moving averages.
- RSI (Relative Strength Index): A gauge of overbought or oversold conditions.
By aggregating these scores, the report provides a "Total Evaluation" that serves as a benchmark for institutional and retail investors. The current 4.0 score reflects a market that is transitioning from recovery to an active bullish phase.
Chronology of the Mid-2026 Recovery
The path to the current 11 million JPY range has been characterized by a disciplined recovery following a period of heightened uncertainty in early June 2026.
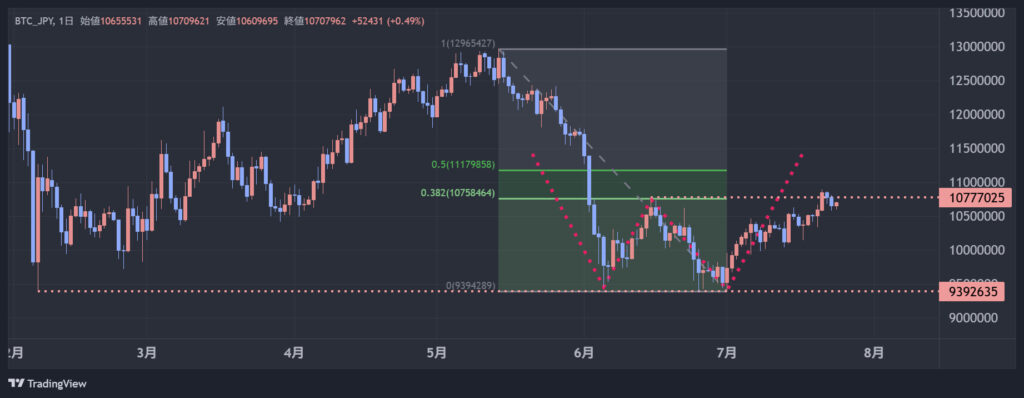
- June 15, 2026: Bitcoin reached a local high of 10.75 million JPY before entering a corrective phase. This level became the primary "neckline" for the subsequent double-bottom formation.
- Late June to Early July 2026: The market experienced a period of "rainy season" consolidation, where prices fluctuated as traders sought a definitive floor. During this time, support was tested near the 9.39 million JPY level.
- Mid-July 2026: A decisive rebound occurred, driven by renewed institutional interest and a stabilization of the Japanese Yen. Bitcoin began its ascent back toward the June highs.
- July 24, 2026: The current report date. Bitcoin has briefly surpassed the 10.75 million JPY mark, reaching as high as 10.90 million JPY. While this breach confirms the bottoming process, analysts are looking for a sustained close above 11.20 million JPY to trigger a full-scale rally.
Detailed Indicator Breakdown and Supporting Data
Chart Pattern Analysis (Score: 4)
The primary structural highlight is the completion of a large-scale double-bottom pattern. This formation is typically a precursor to a major trend reversal. The neckline, established at the June 15 high of 10,750,000 JPY, was breached recently. However, because the price only reached 10,900,000 JPY before pausing, the report notes that the breakout is not yet "clean." There remains a slight possibility of a "fake-out" or bull trap unless the price can clear the next Fibonacci resistance level. The 38.2% Fibonacci retracement level has been reached, and the next target is the 50% retracement, which aligns with the 11.20 million JPY resistance zone.
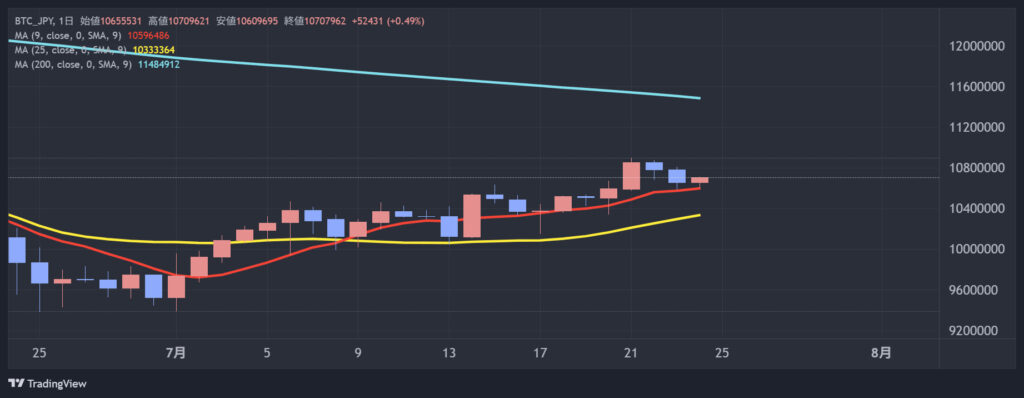
Moving Averages (Score: 5)
The moving average component is currently the strongest part of the Matrix. Following a "Golden Cross"—where the short-term 9-day MA crosses above the medium-term 25-day MA—both lines are now sloping upward. This indicates that the short-term momentum is aligned with the broader recovery trend. Furthermore, the long-term 200-day moving average, currently hovering around 11.40 million JPY, is coming into focus. A break above this "life-line" would signal a return to a long-term bull market.
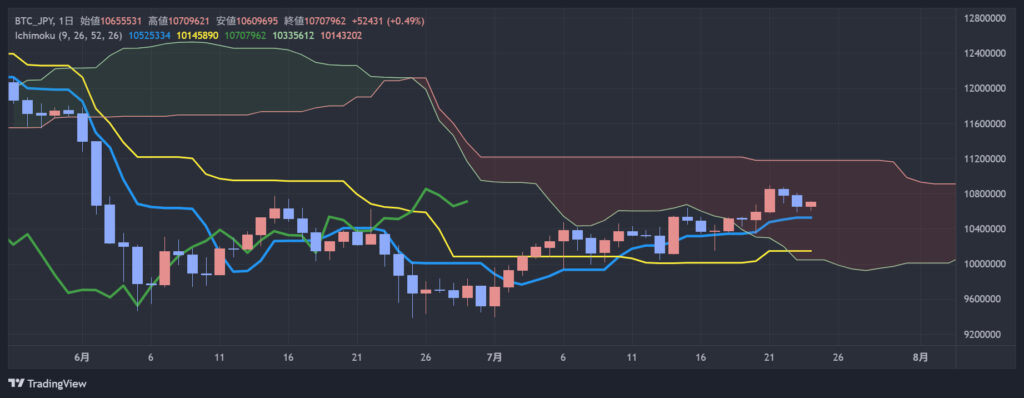
Ichimoku Kinko Hyo (Score: 3)
The Ichimoku analysis remains neutral but promising. The price has successfully entered the "Cloud" (Kumo), which represents a zone of historical resistance and uncertainty. To achieve a "San-yaku Kouten" (Three Signals Turning Positive)—the strongest bullish signal in Ichimoku theory—the price must exit the top of the cloud at 11.20 million JPY. At present, the conversion line (Tenkan-sen) and base line (Kijun-sen) are stabilizing, suggesting that the "rainy season" of price indecision is ending.
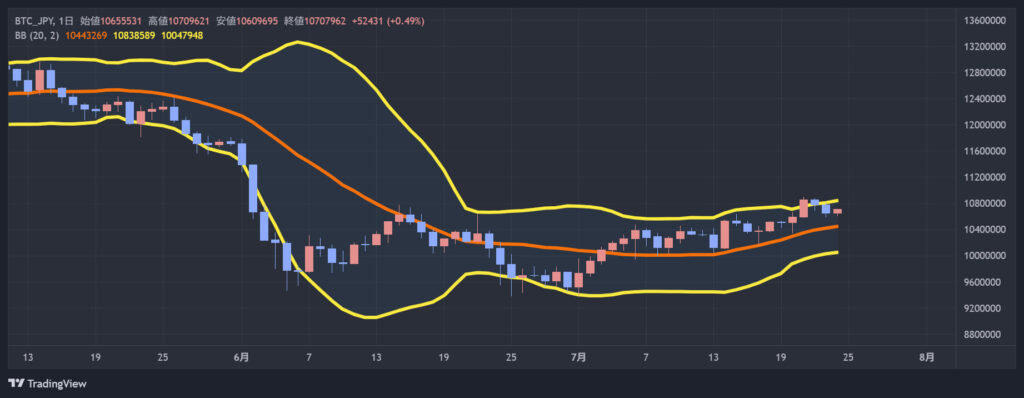
Bollinger Bands (Score: 3)
Interestingly, the Bollinger Bands are currently in a "Squeeze" phase. This occurs when the bands tighten around the price, indicating low volatility. While the price is trending toward the upper band, the lack of an "Expansion" (where the bands open up) suggests that the explosive move associated with a summer rally has not yet begun. Traders often view a squeeze as the "calm before the storm," anticipating a significant breakout in the near future.
MACD and Momentum (Score: 5)
The MACD indicator provides a highly bullish reading. After undergoing a "Bullish Divergence"—where the indicator began rising even as prices were still searching for a bottom—the MACD line has crossed above the signal line. This confirms that the internal momentum of the market has shifted in favor of buyers. The histogram is expanding in positive territory, supporting the case for continued price appreciation.
RSI (Score: 4)
The Relative Strength Index is currently in the mid-60s. This is considered a "healthy" bullish range. It indicates that while buying pressure is dominant, the market is not yet "overbought" (typically above 70 or 80). There is sufficient "headroom" for the price to continue rising toward the 11.20 million JPY target before the market reaches an exhausted state.
Broader Market Context and Economic Implications
The 2026 crypto landscape in Japan is increasingly influenced by the interplay between digital asset volatility and the stability of the Yen. As Bitcoin approaches the 11 million JPY mark, it faces not only technical resistance but psychological barriers. The term "Summer Rally" is frequently used in Japanese financial circles to describe a seasonal increase in liquidity and risk appetite, often coinciding with corporate bonus cycles and mid-year portfolio rebalancing.
Market observers suggest that if Bitcoin can clear the 11.20 million JPY hurdle, it will likely attract significant "FOMO" (Fear Of Missing Out) buying from retail participants who have been waiting on the sidelines during the June consolidation. Furthermore, the proximity of the 200-day moving average at 11.40 million JPY means that institutional algorithmic trading bots may trigger buy orders once that level is breached, potentially accelerating the price toward 12 million JPY.
Official Reactions and Expert Commentary
While Rakuten Wallet maintains a strictly technical and objective stance, the broader sentiment among Japanese crypto-analysts is one of cautious optimism. Spokespersons for major exchanges have noted that the "Matrix Method" provides a necessary anchor in a market often swayed by social media sentiment.
"The objectivity of using six distinct technical layers allows us to filter out the noise of the ‘rainy season,’" noted one senior analyst familiar with the report. "By focusing on the 11.20 million JPY level as the ultimate confirmation, we avoid premature celebrations. However, the alignment of the MACD and the Golden Cross in the moving averages cannot be ignored. The foundation for a summer rally is undeniably present."
Conclusion: Targets for the Summer Rally
As of late July 2026, the Bitcoin market is at a crossroads between consolidation and a major breakout. The "Total Evaluation" score of 4.0 reflects a high probability of upward movement. The immediate roadmap for investors involves two critical price targets:
- 11.20 million JPY: The upper limit of the Ichimoku Cloud and the 50% Fibonacci retracement level. Clearing this would confirm the end of the "rainy season" and the start of the summer rally.
- 11.40 million JPY: The 200-day moving average. A sustained close above this level would transition Bitcoin from a "rebound" phase into a "confirmed bull trend."
Conversely, should the market fail to hold the 10.75 million JPY neckline, a return to the 9.50 million JPY support zone could be expected, delaying the anticipated rally. For now, the technical "weather" in the Bitcoin market appears to be clearing, with sunnier prospects on the horizon for the remainder of the summer season.
Disclaimer: This report is based on technical analysis provided for informational purposes and does not constitute financial advice or a recommendation to buy or sell any assets. Cryptocurrency investments carry significant risk, and final investment decisions should be made based on individual judgment and risk tolerance. Future price predictions are speculative and based on historical data patterns which may not repeat.