Despite persistent bearish pressure threatening to push Ethereum’s price back to the $1,500 support level, the underlying network is demonstrating remarkable resilience and growth, with activity levels reaching historic highs. This intriguing divergence between price action and fundamental strength paints a complex picture for the leading smart contract platform, signaling robust demand and strong holder conviction even as market instability prevails.
The Paradox of Price Instability and Surging Network Health
The cryptocurrency market has recently witnessed a challenging period for Ethereum, with its native token, ETH, experiencing significant downward momentum. The price has been retesting crucial support zones, including the $1,600 mark, leading to widespread concern among investors about further depreciation. Market analysts suggest that a retest of the $1,500 level could occur sooner than anticipated if the bearish sentiment continues to dominate.
However, this short-term price volatility stands in stark contrast to the burgeoning health and activity of the Ethereum network itself. Far from slowing down, engagement across the blockchain has accelerated, reaching levels previously unseen. This dichotomy underscores a fundamental debate within the crypto community: does price reflect true value, or does underlying network utility provide a more accurate long-term indicator? For Ethereum, the latter argument gains significant traction from recent data.
Unprecedented Network Engagement: A Deep Dive into Active Addresses

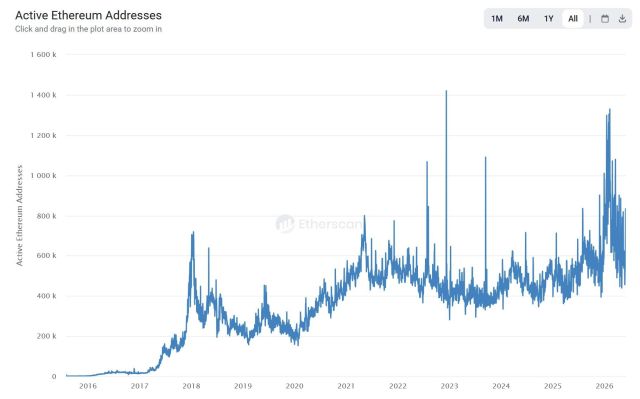
Compelling evidence for Ethereum’s fundamental strength comes from an analysis of its network activity. Reports from Leon Waidmann, Head of Research at Lisk and a respected market expert, highlight a "powerful resurgence" in network engagement. According to Waidmann’s findings, which are corroborated by on-chain data, activity across the Ethereum blockchain is currently sitting at all-time high levels, signaling a profound increase in participation across its vast ecosystem.
Specifically, the daily active addresses on the Ethereum network are hovering near their highest historical range. To put this into perspective, during the peak of the 2018 bull market cycle, active wallet addresses reached approximately 720,000. In the subsequent bull run of 2021, this figure climbed to a peak of 800,000. Remarkably, in the current market cycle spanning 2025 and 2026, daily active addresses have consistently surpassed the 1 million mark, frequently peaking above 1.3 million. This substantial increase indicates that the network is processing significantly more "real activity" now than it did during the apex of previous bull markets.
This sustained growth in active addresses is a critical metric, as it reflects genuine utility and demand. Ethereum continues to serve as the foundational layer for a myriad of decentralized applications (dApps), including decentralized finance (DeFi) protocols, non-fungible tokens (NFTs), and various tokenization projects. The surge in active users, developers, and institutions engaging with these applications underscores Ethereum’s indispensable role in the evolving digital economy. It suggests that despite price fluctuations, the intrinsic value proposition of the network as a robust, programmable blockchain remains exceptionally strong. The increasing engagement signals a growing ecosystem, attracting new participants and solidifying Ethereum’s position as one of the most active and influential networks in the entire cryptocurrency sector.
The Great Exodus: Ethereum Off Exchanges and Strong Holder Conviction
Further reinforcing the narrative of underlying strength is the significant withdrawal of ETH from cryptocurrency exchanges, indicating a strong trend of accumulation rather than selling. As of recent data, the total amount of ETH held on crypto exchanges has plummeted to approximately 14.5 million ETH, marking its lowest level in history. This record low is particularly noteworthy because it occurred during a period of bearish pressure, not before it, which typically sees an increase in exchange balances as investors prepare to sell.
A chronological review of exchange balances reveals a clear trend. In October 2023, the ETH exchange balance stood at around 21 million ETH. Over the subsequent 2.5 years, more than 6 million ETH have been systematically pulled off centralized exchanges. This massive outflow is highly significant. During periods of heightened market volatility and price downturns, exchanges usually experience steady inflows as investors move assets from cold storage to trading platforms in anticipation of selling or hedging. The current situation, however, presents the opposite scenario.

This pattern suggests that a substantial portion of investors are moving their ETH into cold storage or staking protocols, indicating a long-term holding strategy rather than short-term trading. As Leon Waidmann aptly noted, "Whoever is buying here isn’t selling back." This statement encapsulates the sentiment of strong holder conviction, where new demand is being met by investors willing to hold their assets for extended periods, effectively reducing the available supply on exchanges and mitigating immediate selling pressure. Such a trend is often seen as a bullish indicator for the long-term health of an asset, as it points to a belief in future appreciation and a reduced likelihood of mass sell-offs.
Decoding Ethereum’s Price Bottom: The Delta Price Metric
While network activity and exchange balances offer insights into fundamental strength, investors are always keen to understand potential price trajectories, particularly during bear markets. In this context, Ali Charts, a seasoned crypto analyst, has offered a compelling analysis regarding Ethereum’s potential price bottom, utilizing a sophisticated on-chain metric known as the Ethereum Delta Price.
The Delta Price metric is a powerful analytical tool that reflects the intricate connection between investors’ aggregate cost basis (the average price at which all outstanding coins were acquired) and the network’s miner production cost (the cost incurred by miners to produce new coins). Historically, the Delta Price has proven to be remarkably effective in identifying deep accumulation zones and signaling market bottoms for Ethereum. It essentially pinpoints the price level where the network’s fundamental costs and investor psychology converge to create a strong support level.
After a thorough examination of this metric, Ali Charts highlighted a crucial insight: Ethereum’s potential price bottom, according to the Delta Price, sits near the $700 level. The analyst’s model suggests that if historical patterns are to repeat, ETH could experience a retest of this $700 level before embarking on its next sustained upward trend. This analysis, while not a guarantee, provides a data-driven perspective on where long-term investors might consider significant accumulation, based on the metric’s past accuracy in identifying market troughs. It’s a stark reminder that while short-term volatility can be intense, fundamental metrics can offer guidance on potential long-term value areas.
Broader Market Context and Implications for Ethereum
The current state of Ethereum cannot be viewed in isolation. The broader cryptocurrency market is subject to a complex interplay of macroeconomic factors, regulatory developments, and shifts in investor sentiment. Global inflation concerns, rising interest rates, and geopolitical tensions have collectively contributed to a risk-off environment, impacting even well-established assets like Ethereum. The anticipation of stricter regulatory frameworks in various jurisdictions also adds a layer of uncertainty.
Despite these external headwinds, Ethereum’s consistent development and ongoing upgrades (such as the transition to Proof-of-Stake with The Merge and subsequent enhancements like the Dencun upgrade for scalability) continue to bolster its long-term potential. These technological advancements, coupled with the burgeoning network activity, underscore a robust and evolving ecosystem that is increasingly vital for decentralized applications.
The implications of the current data are multifaceted. For short-term traders, the bearish pressure and potential retest of lower price levels signal continued caution. However, for long-term investors and those focused on fundamental growth, the unprecedented network activity and historic exchange outflows present a compelling narrative of accumulation and strong belief in Ethereum’s future. The divergence suggests that while speculative interest may wane during bear markets, the utility-driven demand for Ethereum’s blockchain remains undiminished, if not strengthened. This resilience indicates that the Ethereum network is maturing beyond mere speculative asset and is solidifying its role as critical infrastructure for the decentralized web.
The combination of surging active users, decreasing exchange supply, and a historically reliable metric pointing to a potential long-term bottom creates a nuanced outlook. While the immediate price action remains challenging, the underlying health of the Ethereum network suggests a strong foundation for future recovery and growth, positioning it as a pivotal player in the ongoing evolution of the digital economy. The current period, therefore, might be viewed as a critical phase of consolidation and accumulation for a network that continues to demonstrate its fundamental importance and expanding utility.