

Bitcoin (BTC) is currently facing renewed downward pressure, slipping decisively beneath the psychologically and technically significant $80,000 threshold. Trading near $75,675 and marking a single-session decline of approximately 6.15%, the world’s leading cryptocurrency has triggered alarms across financial markets. This retreat comes on the heels of a broader wave of macroeconomic volatility, drawing sharp scrutiny from market strategists who are closely monitoring correlations with traditional equity markets, specifically the technology-heavy NASDAQ 100.
While prominent macro analyst Benjamin Cowen has warned that an ongoing correction in traditional tech equities could drag Bitcoin back toward its summer lows, on-chain metrics from analytics firm Glassnode present a more resilient picture of underlying spot trading activity. As market participants dissect mixed signals from technical indicators, derivatives liquidations, and liquidity trends, the critical $73,000 support region has emerged as the definitive battleground for determining whether the current market correction will deepen into a severe multi-month downturn or stabilize into healthy consolidation.
The Macroeconomic Catalyst and Tech Sector Correlation
The recent retreat in Bitcoin prices does not exist in a vacuum. It coincides with a period of heightened turbulence across global financial markets, driven by shifting investor risk appetite, evolving monetary policy expectations, and macroeconomic headwinds. A primary catalyst behind the current bearish sentiment is the performance of traditional risk-sensitive assets, most notably the NASDAQ 100 index.
Historically, Bitcoin has maintained a variable yet often pronounced correlation with high-growth technology stocks. Both asset classes tend to thrive in loose monetary environments characterized by high market liquidity and expand during periods of aggressive risk-seeking behavior by institutional investors. Conversely, when macroeconomic stress prompts capital flight out of risk assets, both the NASDAQ and Bitcoin frequently experience synchronized drawdowns.

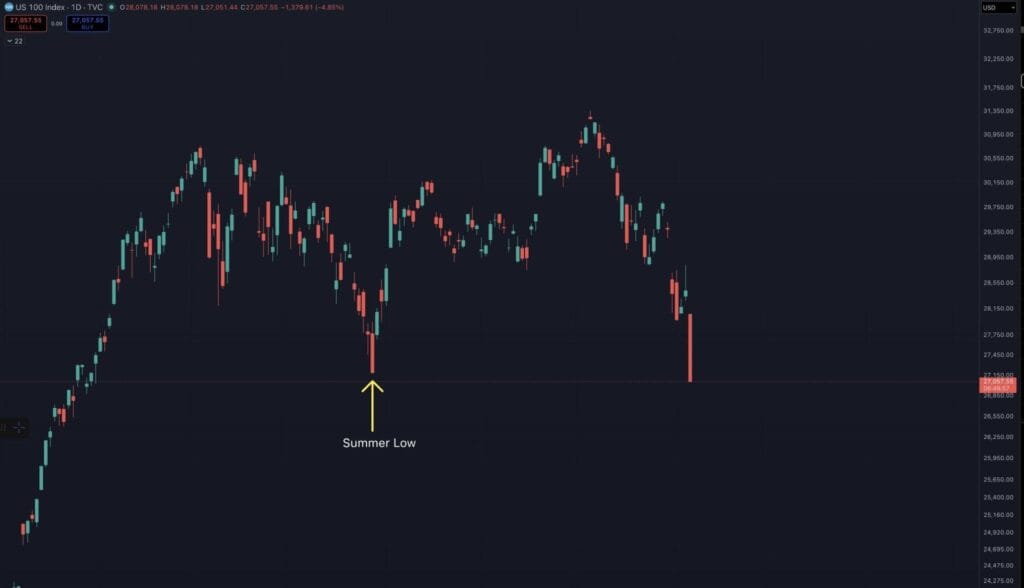
This vulnerability was underscored during a volatile U.S. trading session on November 5, when the NASDAQ-100 suffered a sharp 6.4% decline. Simultaneously, Bitcoin slid toward the mid-$76,000 range. Highlighting this historical relationship, macro analyst Benjamin Cowen took to social media platform X to warn investors of the structural risks facing the cryptocurrency if equity markets continue their downward trajectory.
"If the NASDAQ can go back to the summer lows, then so can Bitcoin," Cowen noted, directing market attention to previous price floors established during the warmer months. Cowen’s thesis aligns with his broader cyclical research published in late October, titled Bitcoin and the Cycle Clock, wherein he identified the structural likelihood of a post-summer quarterly low following earlier corrections in February. Utilizing quantitative regression models, Cowen pinpointed approximately $72,100 as a critical first-percentile boundary. In a worst-case scenario where traditional markets experience a systemic correction, Cowen’s models suggest that Bitcoin could eventually test support levels near $58,000, effectively erasing a significant portion of its post-summer recovery rally.
Derivatives Flush and the Anatomy of the Selloff
The velocity of Bitcoin’s recent pullback has been amplified significantly by activity within the cryptocurrency derivatives market. As spot prices breached key psychological barriers and broke down through moving averages, leveraged long positions bore the brunt of the volatility.
Market data from tracked derivatives instruments recorded a staggering $1.24 billion in total liquidations over a compressed 24-hour window. Of this total, approximately $325 million in liquidations were attributed directly to Bitcoin-tracked instruments. Crucially, long positions accounted for roughly 90% of all BTC liquidations. This massive flushing of leveraged accounts illustrates a classic cascading liquidation loop, where falling spot prices force automated margin calls, driving prices lower in a self-reinforcing cycle.
However, financial analysts emphasize an important distinction between derivatives-driven liquidations and actual spot-market capital flight. While forced liquidations dramatically increase short-term volatility and depress paper valuations, they do not necessarily mean that equivalent amounts of institutional or retail capital have permanently exited the spot ecosystem.
Glassnode Data Reveals Underlying Spot Market Resilience
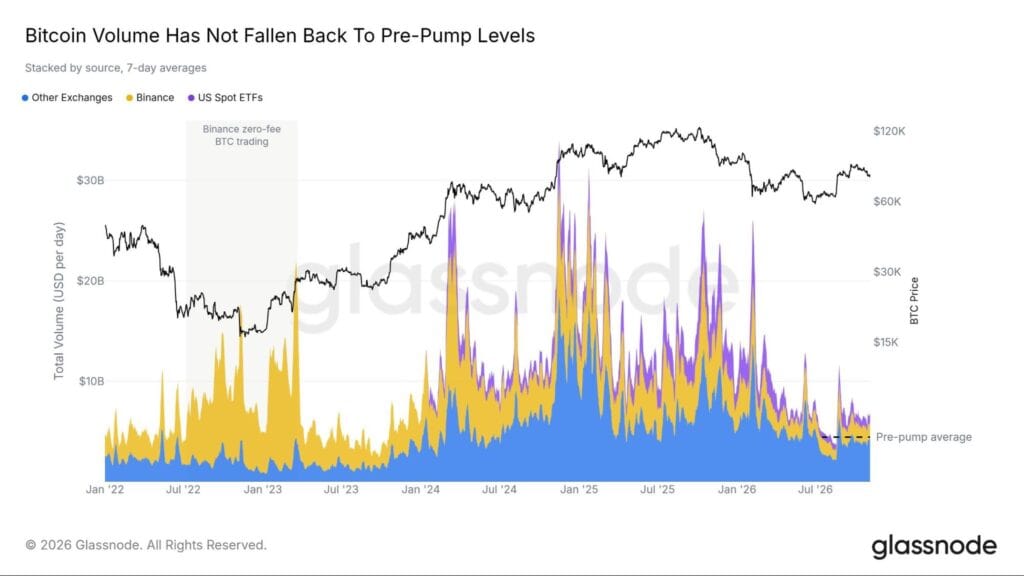
Providing a vital counterpoint to the bearish technical charts and derivatives bloodbath, on-chain data from Glassnode reveals that foundational spot trading activity is holding firm. Despite Bitcoin retreating sharply from its recent cyclical highs near $120,000 down to the mid-$75,000 range, overall market participation has avoided a complete collapse.
Glassnode’s seven-day moving average spot trading volume metric—which aggregates transactional activity across major global centralized exchanges, Binance, and the newly established U.S. spot Bitcoin exchange-traded funds (ETFs)—demonstrates that trading volumes remain safely above the depressed trough levels recorded prior to the August market surge. In previous cyclical lows, such as the prolonged stagnation phases observed in 2023, spot trading volumes dried up entirely, reflecting widespread apathy and a lack of active market participants.
The current environment, by contrast, is characterized by persistent high engagement. Although the net balance of market orders currently favors sellers, the presence of sustained trading volume indicates that both buyers and sellers remain highly active. While elevated volume during a market correction can sometimes point to institutional distribution and profit-taking rather than immediate accumulation, the absence of apathy suggests that market infrastructure remains robust. Investors are actively trading and reallocating positions rather than abandoning the asset class entirely.
Technical Indicators and Moving Average Breakdown
From a technical perspective, Bitcoin’s short-term and medium-term momentum indicators heavily favor the bears. TradingView’s aggregated technical summaries paint a bleak picture across multiple timeframes, registering 16 sell signals, nine neutral readings, and just a single buy signal.
The moving average (MA) structure highlights the sheer scale of Bitcoin’s recent descent from its higher trading ranges. The 10-day exponential moving average (EMA) sits near $77,860, while the 20-day EMA rests around $79,100. Furthermore, the 50-day simple moving average (SMA) is anchored at approximately $81,974, towering well above current market spots.
Momentum oscillators further validate this persistent downward pressure. The Relative Strength Index (RSI) hovers near 38, signaling declining momentum without yet breaching the deeply oversold threshold of 30. Other momentum benchmarks, including the Awesome Oscillator (standing near -3,774) and the Moving Average Convergence Divergence (MACD) level (approximating -1,403), continue to flash definitive sell signals.
Amid this cascade of negative indicators, only longer-term metrics offer a glimmer of hope. The 200-day simple moving average, situated at approximately $73,190, stands as one of the few moving averages generating a buy signal, emphasizing that Bitcoin’s macro bull market structure has not yet been entirely invalidated on high timeframes.
Defining the Battleground: Critical Support and Resistance Levels
As Bitcoin searches for a definitive bottom, technical analysts and chartists have mapped out precise price corridors that will dictate market direction in the coming sessions. The immediate downside focus centers squarely on the $75,400 to $73,300 region.
According to the Camarilla pivot system, immediate downside support levels are established near $75,405 and $74,392. Meanwhile, classic pivot calculations identify the first major structural support floor at approximately $73,329, aligning closely with the vital 200-day SMA. A successful defense of the $73,000 to $75,000 band could allow Bitcoin to build a protracted consolidation base, soaking up remaining selling pressure and neutralizing the immediate threat of a deeper capitulation event.
Conversely, a decisive, high-volume breakdown beneath the $73,000 threshold would expose the market to catastrophic technical damage. Should this support fail, the next major classic pivot support waits down near $69,227, opening the door for a rapid slide toward the deeper macro targets outlined by analysts like Benjamin Cowen.
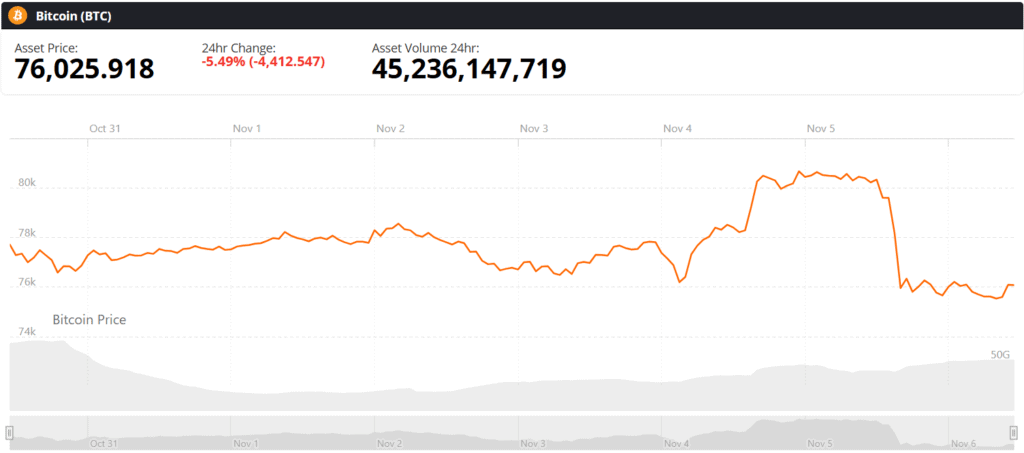
On the bullish front, the pathway to recovery is equally well-defined. For Bitcoin to signal any genuine short-term stabilization, bulls must reclaim the $77,000 to $78,000 zone. A broader resistance barrier extends from $79,000 to $80,000, where multiple moving averages and key pivot lines converge. Only a sustained daily close above the psychological $80,000 mark would successfully invalidate the prevailing short-term bearish structure and convince sidelined institutional capital that the worst of the correction has passed.
Broader Implications and Outlook
The convergence of macro equity pressures, heavy derivatives liquidations, and persistent technical weakness has placed Bitcoin at a crucial macro crossroads. The primary question facing investors is whether enduring spot market participation and institutional ETF inflows can successfully absorb the wave of selling pressure while traditional financial markets remain volatile.
While macroeconomic correlations with the NASDAQ 100 and external geopolitical or monetary shocks will continue to exert influence, the immediate fate of the asset rests on its ability to defend the $73,000 support floor. As the market digests these competing signals, traders and long-term holders alike will be closely watching volume trends, exchange inflows, and equity market behavior to gauge whether Bitcoin is preparing for a durable recovery or bracing for a deeper winter.