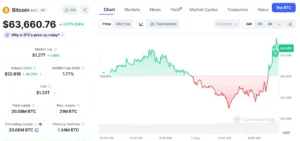
The cryptocurrency market has entered a pivotal transition phase as Bitcoin retreats from earlier yearly highs, trading away from the euphoria that defined its previous rallies and moving into a historically significant Dollar-Cost Averaging (DCA) zone. This psychological and structural shift has captured the attention of analysts, long-term investors, and institutional market observers alike. Rather than signaling a permanent structural breakdown, historical cycle analysis suggests that this region of depressed sentiment and subdued price action closely mirrors the foundational accumulation phases observed prior to past macro bull runs.
Current price metrics place the leading digital asset near the $62,800 threshold, testing key technical support levels on monthly and daily charts. As the market weighs macroeconomic crosscurrents against on-chain data, industry analysts are evaluating whether this localized capitulation and fear-driven environment will serve as the launchpad for Bitcoin’s next historic upward trajectory or if extended consolidation lies ahead.
Decoding the Historical DCA Accumulation Zone
Market structure analysis shared widely by crypto analysts on social media platforms highlights a recurring market psychology pattern: prolonged periods of despondency, widespread declarations of the asset’s demise, and the subsequent formation of a long-term DCA accumulation region. Historically, these zones have consistently preceded massive supply shocks and subsequent rallies toward new all-time highs.
A macro examination of the monthly candlestick chart reveals striking structural parallels across previous market cycles. In 2019, following a punishing bear market that saw the asset decline by more than 83% from its 2017 peak near $19,000, Bitcoin entered a prolonged depression and accumulation phase. This foundational base ultimately set the stage for the explosive bull run that culminated in the 2021 all-time high of approximately $69,000.

A remarkably similar phenomenon occurred during the 2022 market cycle. Following the cascading liquidations and market-wide contagion triggered by the collapse of the FTX exchange in November 2022, Bitcoin plummeted to a cycle low of around $15,500 from its previous peak. Despite the prevailing macroeconomic pessimism and regulatory headwinds, resilient accumulation by long-term holders absorbed the forced selling. This accumulation phase preceded an extraordinary rally of nearly 600%, driving prices above the historic $100,000 milestone and eventually establishing a new record peak above $126,000 in October 2025.
Current Market Dynamics and Technical Landscape
At the time of writing, Bitcoin is changing hands around $62,800, hovering directly above the curved macro support line established on monthly timeframes. The persistence of this long-term structural alignment keeps the comparisons to the 2019 and 2022 accumulation periods structurally valid, even as short-term traders grapple with heightened volatility.
However, the contemporary market environment is heavily influenced by competing structural forces, notably institutional exchange-traded fund (ETF) capital flows and shifting on-chain network metrics. Recent data indicates that Bitcoin’s Realized Cap has contracted by roughly $12 billion from its mid-May peak, reflecting capital outflows and profit-taking by earlier cohorts. Furthermore, proprietary evaluations of the Bitcoin Profit and Loss (PnL) Index suggest that while the asset remains firmly embedded in a transition phase, it has not yet definitively registered a final cycle bottom.
Market experts emphasize that the absence of an immediate bottom indicator does not invalidate the bullish DCA thesis. In fact, historical precedent demonstrates that accumulation zones rarely form amidst calm market conditions or guaranteed certainty. Instead, they typically materialize when liquidity is constrained, market participation wanes, and retail traders are actively anticipating a deeper correction.
Macroeconomic Pressures and Institutional Reactions

The broader financial ecosystem is currently navigating a complex web of monetary policy decisions, shifting regulatory frameworks, and macroeconomic uncertainty. Institutional market participants, ranging from corporate treasury adopters to sovereign wealth observers, continue to monitor Bitcoin’s deflationary architecture and its long-term viability as a macro hedge.
While short-term derivative markets and spot ETF trading volumes have experienced periods of cooling, corporate accumulation strategies persist. Executives from major digital asset exchanges and financial institutions have repeatedly characterized prolonged price corrections and discount phases as healthy consolidation periods that facilitate broader institutional onboarding. By allowing institutional allocators to build substantial positions without sparking immediate supply crunches, these accumulation phases help establish a resilient market floor.
Chronology of Bitcoin Macro Cycles
To understand the significance of the current DCA zone, it is instructive to examine the chronological progression of Bitcoin’s major cyclical phases over the past decade:
2017–2019 Bear Market and Recovery: Following the late 2017 retail-driven surge to $19,000, Bitcoin endured an 18-month bear market, establishing a durable DCA accumulation base throughout 2019 before breaking out in late 2020.
2021–2022 Capitulation Event: After peaking at $69,000 in November 2021, the market suffered consecutive shocks, culminating in the FTX collapse in November 2022, which drove prices down to a cycle low near $15,500.
2023–2025 Expansion Phase: Strong accumulation during the post-FTX phase fueled a multi-year recovery, driving Bitcoin past $100,000 and establishing a new all-time high above $126,000 in October 2025.
2026 Transition and Current DCA Zone: Following the subsequent correction from late-2025 highs, Bitcoin has returned to a familiar historical accumulation band around the low $60,000s, characterized by fear, reduced liquidity, and institutional re-positioning.
Broader Impact and Market Implications
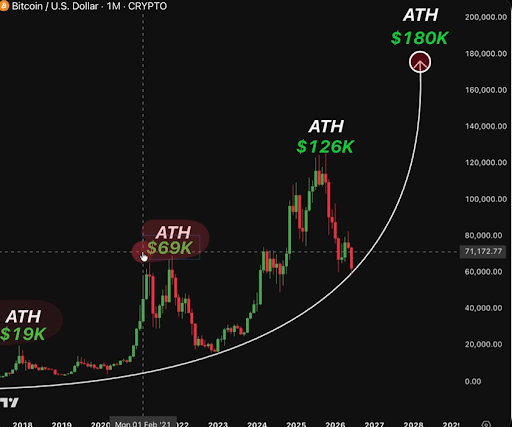
The transition of Bitcoin into a sustained DCA accumulation zone carries profound implications for both retail and institutional investors. For long-term market participants, these phases represent strategic windows to acquire digital assets at valuations decoupled from peak market sentiment. The compression of speculative leverage during such periods typically purges weaker market participants, laying the groundwork for a more stable and sustainable supply-demand equilibrium.
Conversely, the immediate outlook remains fraught with technical challenges. If macroeconomic headwinds intensify or if institutional ETF outflows accelerate beyond current projections, Bitcoin could test deeper support tiers before establishing a definitive macro bottom. Conversely, a stabilization of on-chain liquidity coupled with renewed accumulation by whale cohorts could validate the historical parallels to 2019 and 2022, setting the stage for the next cyclical expansion.
As the cryptocurrency market navigates this critical juncture, analysts and investors will continue to monitor key on-chain indicators, realized capitalization trends, and macro liquidity metrics to determine whether the current fear-driven environment will once again prove to be the precursor to a historic market recovery.