The precious metals market has entered a precarious phase as silver prices extend a steep downward correction through the month of October. Following a robust push that saw the white metal trade well above the $57 per ounce threshold earlier in the month, a sudden shift in momentum has triggered a swift retracement. Investors and market analysts are now closely monitoring whether prevailing selling pressure will persist or if key support levels will hold firm, potentially paving the way for a year-end market recovery.
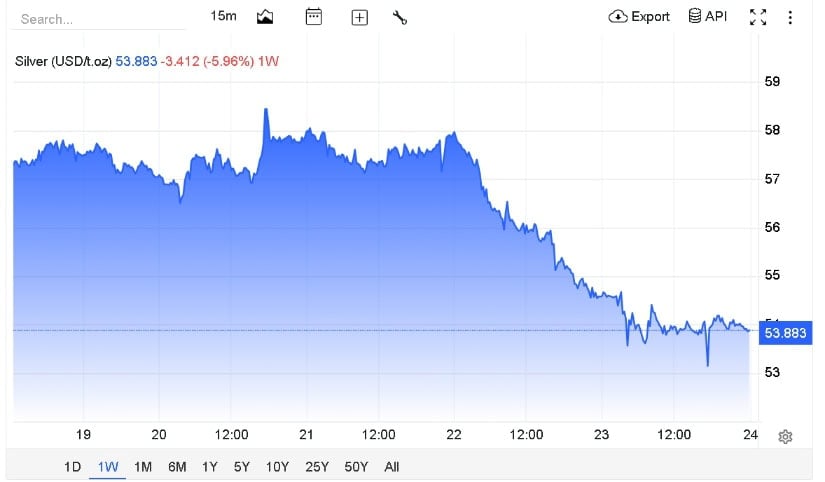
Recent trading sessions have underscored the magnitude of this correction. Data compiled from Trading Economics indicates that silver prices tumbled by approximately 5.96% over a single week, settling near the $53.88 per ounce mark. This aggressive downward movement has severely tested the psychological and technical mid-$50s range, forcing traders to reassess their positions as the fourth quarter unfolds. The contraction represents a significant departure from the optimistic highs achieved earlier in the period, leaving market participants wary of further downside risks.
Chronology of the October Correction
The current downturn did not occur in a vacuum; rather, it represents the culmination of escalating selling pressure that began gathering momentum mid-month. The timeline of the pullback highlights how quickly market sentiment can shift in the commodities sector.

On October 22, market anxiety intensified when silver prices decisively breached the crucial $56 support level. This breach acted as a technical catalyst, accelerating the sell-off as automated stop-loss orders and short-term speculative liquidations took effect. Within 48 hours, the asset descended rapidly toward the $54 region.
By October 24, prices were hovering precariously around $53.91 per ounce, reflecting a further intraday decline of roughly 1.26%. While a minor period of price consolidation was observed late in the week, technical analysts were quick to point out that this sideways movement lacked the conviction necessary to signal a genuine longer-term market reversal. Instead, the market remained locked in a defensive posture, waiting for broader macroeconomic catalysts to dictate its next directional move.
Technical Structure and Indicator Analysis
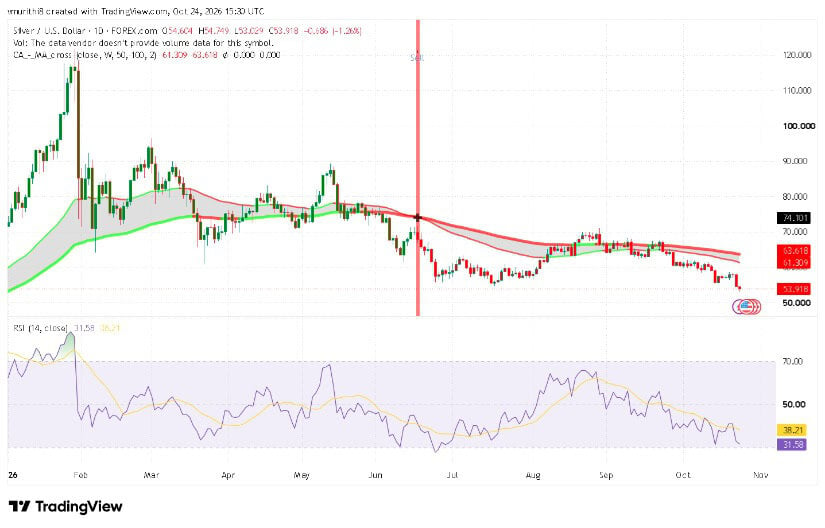
A detailed examination of technical indicators reveals a decidedly weak structural setup for silver heading into the final stretch of the fourth quarter. Chart analysis provided by TradingView highlights a pronounced bearish alignment, with moving averages continuing to trend downward well above current spot prices. Specifically, key moving averages tracked at $61.30 and $63.61 underscore the extent to which recent price action has been suppressed.
Furthermore, momentum indicators are signaling extreme caution. The Relative Strength Index (RSI), a widely utilized metric for gauging overbought and oversold conditions, dipped to 31.58 during the height of the October sell-off. This reading sits comfortably below the average baseline of 38.21 and edges dangerously close to the traditional oversold threshold of 30.
While an RSI reading near 30 often hints at a potential bullish bounce, veteran technical analysts emphasize that oversold conditions can persist indefinitely during strong downward trends, particularly when accompanied by high volume. Consequently, market participants are eyeing the immediate technical zone between $53 and $55 as a critical battleground. A decisive breakdown beneath the $53 floor would expose the metal to accelerated losses, potentially dragging prices down toward the psychologically significant $50 level. Conversely, a sustained recovery above the $55 mark would be required to signal initial stabilization before buyers could even contemplate testing resistance zones in the $61 to $64 range.
Macroeconomic Drivers: Yields, the US Dollar, and Monetary Policy
The downward pressure on silver cannot be viewed in isolation; it is deeply intertwined with broader macroeconomic headwinds currently buffeting the global financial markets. Resurgent US Treasury yields, a strengthening US dollar, and shifting expectations regarding central bank interest-rate trajectories have combined to create a hostile environment for non-yielding assets.
As borrowing costs remain elevated for longer than anticipated, opportunity holding costs for precious metals rise, dampening investor appetite. Commentary from financial institutions, including a market note released by FOREX.com on October 23, underscored that silver has effectively found a long-term cyclical support base within the $50 to $55 range following a broader, market-wide liquidation across the precious metals complex.
Market strategists note that the trajectory of silver for the remainder of the fourth quarter will remain acutely sensitive to incoming US economic data. Fluctuations in inflation prints, employment reports, and subsequent pronouncements from Federal Reserve officials will directly influence the strength of the greenback and the direction of real yields, which in turn dictate institutional flows into commodities.
Long-Term Outlook and Diverging Analyst Forecasts
Despite the prevailing short-term bearishness, longer-term projections for silver exhibit a stark divergence between institutional baseline forecasts and speculative bull cases.
Earlier in the year, major financial institutions outlined relatively optimistic baseline scenarios for the latter half of 2026. For instance, projections published by J.P. Morgan in August anticipated an average price of $63 per ounce for the fourth quarter, with an annual average target reaching $70.60 per ounce. These forecasts were predicated on expectations of easing physical market tightness, shifting industrial demand dynamics, and anticipated monetary policy easing. However, analysts are careful to clarify that these figures represent macroeconomic averages rather than guaranteed terminal prices for the year.
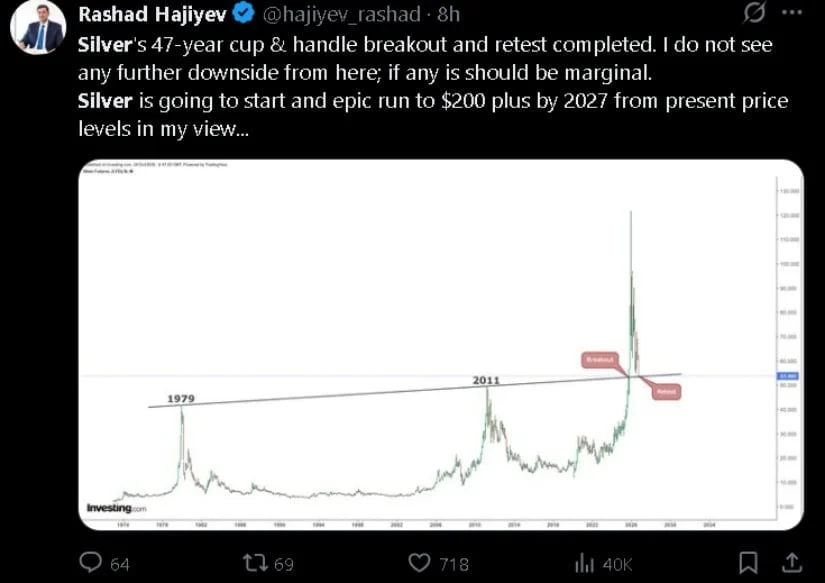
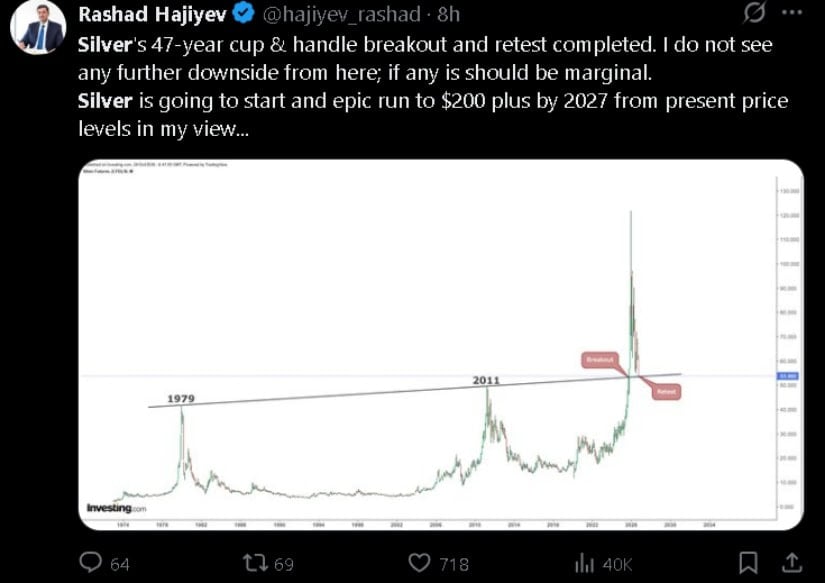
Contrasting with these measured institutional outlooks, more speculative voices in the retail and social trading sphere have articulated highly aggressive long-term targets. Notable market commentators, such as analyst Rashad Hajiyev, took to social media platforms like X to highlight what they perceive to be a massive long-term cup-and-handle technical breakout and retest on higher-timeframe charts. Such bullish interpretations have led to ambitious, albeit highly speculative, projections suggesting that silver could potentially scale heights toward $200 per ounce by 2027.
Market historians and risk managers caution that such extreme bullish scenarios require fundamentally altered market conditions, including massive speculative inflows, severe structural supply deficits, and a wholesale regime change in global monetary policy. For the immediate future, buyers would first need to wrest control of market momentum and decisively break through heavy technical overhead resistance situated near the $60 to $63 range before any discussion of secular bull runs can become reality.
Implications for Investors and Year-End Expectations
As the market navigates the remainder of October and looks ahead to December, prudence remains the dominant theme among professional traders. The immediate focus rests squarely on whether the $53 to $55 support band will hold against persistent macroeconomic headwinds.
A failure to defend these lower boundaries risks triggering a deeper correction toward the $50 psychological mark, while a successful consolidation and subsequent break above $55 could offer a glimmer of hope for a modest year-end recovery rally. Ultimately, the path of least resistance for silver over the final months of the year will depend on a delicate equilibrium between physical industrial demand, shifting investment flows, and the broader macroeconomic policy landscape.