• Home
Crypto Gohan
keep your memories alive
Altcoins & Token Projects

Dubai Investor Royal Kane Rejects XRP Amid Market Downturn and Regulatory Uncertainty

by Basiran September 17, 2026
written by Basiran

XRP, one of the most prominent digital assets in the global cryptocurrency market, has entered a period of intense scrutiny as it struggles to maintain critical support levels. The asset’s downward trajectory has been punctuated by a high-profile dismissal from prominent Dubai-based investor Royal Kane, who has explicitly ruled out the token from his investment portfolio. This development arrives at a juncture where XRP is facing a confluence of negative headwinds, including a broader macroeconomic shift driven by Federal Reserve policy and a significant legislative setback in the United States Senate regarding crypto-market structure.

The Investment Thesis of Royal Kane

Royal Kane, a well-known voice in the digital asset investment space, took to social media platform X on September 17, 2026, to clarify his stance on Ripple’s native token. His rejection of the asset is rooted in a fundamental critique of its current market valuation versus its perceived utility and revenue generation.

Kane noted that his decision is driven by the token’s roughly $81 billion market capitalization, which he deems excessive given what he characterizes as a lack of tangible, revenue-generating products directly linked to the token’s performance. "I would never invest in Ripple at this stage because its market cap is already too large," Kane stated. His analysis posits that for an investor seeking high-growth opportunities, XRP represents a mature asset that has already seen its most explosive growth cycles, leaving little room for the asymmetric upside often sought by aggressive portfolio managers.

XRP Sparks Major Red Flag For Dubai Investor: “I Would Never Invest In Ripple”

Instead of focusing on established, large-cap assets, Kane advocates for a strategy centered on identifying tokens with smaller market capitalizations and more compelling growth narratives. He pointed toward the "ETH killer" narrative that has historically fueled Solana’s growth, as well as the community-driven momentum surrounding tokens like Pepe. Furthermore, he highlighted Zcash, noting that its adoption trajectory mirrors early-stage Bitcoin, albeit with a unique supply-side narrative that differentiates it from the rest of the market. Kane’s public stance serves as a reminder of the shifting sentiment among sophisticated investors who are increasingly rotating capital away from legacy altcoins toward projects with fresh market stories.

A Chronology of Declining Momentum

The current market sentiment surrounding XRP is best understood through its performance over the last 20 months. At the dawn of 2025, XRP was trading near the $3.04 mark, reflecting a period of optimistic market sentiment and high liquidity. However, the asset has faced a relentless series of pullbacks throughout 2026.

By mid-2026, the price had drifted below the $1.70 threshold, signaling a loss of buyer confidence and a reduction in long-term accumulation. The downward trend intensified throughout the summer, leading to the current state where the asset is hovering near the $1.30 support level. Year-to-date (YTD) performance data shows that XRP has shed approximately 29.18% of its value, significantly underperforming broader crypto market benchmarks.

The 24-hour trading volume currently sits at approximately $4.12 billion, a figure that, while substantial, indicates a consolidation phase rather than a breakout. Technical analysts have noted that the failure to hold the $1.50 support level has left the asset vulnerable to further erosion, particularly as the market capitalization remains locked near the $81 billion range, creating a "dead weight" effect for short-term traders.

XRP Sparks Major Red Flag For Dubai Investor: “I Would Never Invest In Ripple”

The Macroeconomic Pressure: Federal Reserve Policy

XRP’s decline does not exist in a vacuum; it is occurring alongside a broader contraction in risk assets caused by the Federal Reserve’s monetary policy. On September 16, 2026, the Federal Open Market Committee (FOMC) implemented a 25-basis-point interest rate hike, moving the target range to 3.75% to 4%.

This decision was met with immediate concern from global financial markets. The "higher-for-longer" interest rate environment increases the opportunity cost of holding non-yielding assets like cryptocurrencies. With 12 out of 18 Fed officials signaling the potential for further rate hikes before the end of the year, the appetite for risk is diminishing. Institutional and retail traders are increasingly moving capital into short-term Treasury bills and other interest-bearing vehicles, which directly impacts the liquidity available for volatile digital assets like XRP.

Legislative Hurdles: The CLARITY Act Setback

Compounding the macroeconomic pressure is a recent failure in the United States legislative arena. The crypto market structure bill, known as the CLARITY Act, faced a critical defeat in the U.S. Senate on September 15, 2026. The bill, which was intended to provide a comprehensive regulatory framework for digital assets, failed to invoke cloture, a procedural move required to end debate and move to a final vote.

The measure required 60 votes to advance but only secured 49 in favor, with 50 senators voting against it. Notably, the opposition included a bipartisan mix, with four Republican senators joining the Democratic majority in blocking the bill. This legislative failure has sent a chilling signal to the industry, suggesting that clear regulatory guidance for assets like XRP may remain elusive for the foreseeable future.

XRP Sparks Major Red Flag For Dubai Investor: “I Would Never Invest In Ripple”

The market reaction to the CLARITY Act defeat was swift. XRP experienced a sharp 7.3% decline in the immediate aftermath, falling to $1.31. This drop was particularly painful for holders, as it followed a recent localized peak of $1.68, representing a 23% correction from that short-term high. The failure of the bill has effectively removed a potential catalyst for price appreciation, leaving the asset to be dictated entirely by market forces and macroeconomic data.

Analysis of Implications for XRP Holders

The confluence of these factors—investor skepticism, technical weakness, rising interest rates, and legislative gridlock—places XRP in a difficult position. For institutional holders and long-term investors, the focus has shifted from "when will the breakout occur" to "where is the structural floor."

  1. Valuation Concerns: As Royal Kane noted, a market cap of $81 billion necessitates significant institutional inflow to move the price needle. Without a clear narrative shift or a major technological or commercial breakthrough that generates independent revenue, the token risks becoming a "zombie" asset in the eyes of aggressive growth investors.
  2. Regulatory Risk: The defeat of the CLARITY Act indicates that the U.S. regulatory environment will remain fragmented and hostile. For Ripple, a company whose business model is deeply tied to cross-border payments and institutional adoption, this lack of clarity complicates global expansion and partnership efforts.
  3. Market Sentiment vs. Utility: The divergence between XRP’s price performance and the broader market’s enthusiasm for newer, narrative-driven tokens (like those in the AI or meme-coin sectors) suggests that retail interest is waning. When a large-cap asset stops attracting new capital, it often undergoes a prolonged period of consolidation or slow decline as early investors take profits and move into more volatile, higher-reward sectors.

Looking Ahead

The path forward for XRP will likely depend on three key variables: the potential for a reversal in the Fed’s hawkish stance, the emergence of a clear legislative path for crypto in Washington, and the ability of Ripple to showcase concrete, revenue-driving utility that can justify its market valuation to skeptical investors.

Until these conditions change, the bearish sentiment expressed by market observers like Royal Kane is likely to persist. Investors are being advised to closely watch the $1.25 support level; a breach of this floor could trigger a secondary wave of selling as stop-loss orders are triggered. Conversely, any positive development in the regulatory or macro sphere could provide the necessary catalyst for a trend reversal, though analysts suggest that the window for a recovery in 2026 is rapidly closing.

XRP Sparks Major Red Flag For Dubai Investor: “I Would Never Invest In Ripple”

In conclusion, while XRP remains a foundational asset within the digital currency ecosystem, its current standing is clearly under duress. The combination of high-level skepticism, unfavorable macroeconomic conditions, and the failure of crucial regulatory legislation has created a challenging environment that investors and market participants will need to monitor with extreme caution in the coming quarters.


September 17, 2026 0 comment
0 FacebookTwitterPinterestEmail
Japanese & Asian Crypto Markets

日銀の利上げ方針は妥当か?物価高とトランプ氏の政権方針が経済の岐路に立たせる

by Rifan Muazin September 17, 2026
written by Rifan Muazin

The intersection of central bank monetary policy, foreign exchange dynamics, and shifting political landscapes continues to dominate global financial discourse, forcing policymakers and investors alike to reevaluate traditional economic models. As central banks across developed economies navigate the delicate balance between curbing persistent inflationary pressures and supporting fragile domestic growth, Japan finds itself at a critical juncture. The Bank of Japan (BOJ) faces mounting scrutiny over its ongoing monetary normalization trajectory, particularly as it intersects with broader global macroeconomic shifts, including potential policy changes from the United States Federal Reserve and the unique challenges posed by domestic currency depreciation.

At the heart of the current debate is the trajectory of Japanese interest rates. Following decades of unconventional monetary easing characterized by negative interest rates and aggressive asset purchases, the BOJ has initiated a cautious shift toward tighter policy. However, the pace and magnitude of these adjustments remain a subject of intense debate among economists, financial analysts, and political figures. With inflation remaining above the central bank’s target and the Japanese yen experiencing periods of extreme volatility against major currencies, the pressure on the BOJ to accelerate its normalization path has intensified. Simultaneously, market participants are closely monitoring the broader implications for risk assets, including equities and cryptocurrencies, as global liquidity conditions tighten.

Macroeconomic Background and the BOJ Policy Pivot

The recent policy adjustments by the Bank of Japan mark a historic departure from the aggressive stimulus measures that defined the tenure of former Prime Minister Shinzo Abe’s economic policies, commonly known as "Abenomics." For years, the BOJ maintained an ultra-loose monetary stance, utilizing yield curve control and massive asset purchases to lift the Japanese economy out of deflationary stagnation. However, structural shifts in global supply chains, rising imported energy costs, and a depreciating yen have fundamentally altered the economic landscape.

In March, the BOJ took a monumental step by abandoning its negative interest rate policy, raising borrowing costs for the first time in 17 years. This was followed by subsequent deliberations on whether further rate hikes are necessary to stabilize the domestic currency and anchor inflation expectations. The central bank’s primary objective has shifted from fighting chronic deflation to preventing excessive currency depreciation, which disproportionately harms consumers by driving up the cost of imported food and energy.

Despite these policy changes, real interest rates in Japan remain deeply negative when adjusted for inflation. This divergence between domestic borrowing costs and those in other major economies, particularly the United States, has kept downward pressure on the yen, complicating the BOJ’s efforts to achieve sustainable, wage-led economic growth.

Chronology of Recent Monetary Policy Decisions

The evolution of Japanese monetary policy over the past year has been marked by several key milestones that reflect the central bank’s gradual exit from decades of extraordinary stimulus:

  • Early Spring: The BOJ officially terminates its negative interest rate policy, lifting the unsecured overnight call rate to a range of 0.0% to 0.1%. This historic decision ends a policy framework that had been in place since 2016.
  • Summer Meetings: As inflation metrics continue to print above the 2% target, discussions within the BOJ policy board center on the necessity of further normalization. Market expectations for additional rate hikes intensify as the yen hovers near historic lows against the U.S. dollar.
  • Autumn Policy Shift: The central bank implements another incremental rate hike, pushing the policy rate higher while signaling that future adjustments will depend strictly on incoming economic data. This move triggers renewed volatility in bond markets and prompts a reassessment of corporate borrowing strategies.
  • Recent Developments: Policymakers emphasize a data-dependent approach, balancing the risk of premature tightening against the danger of falling behind the curve as global central banks begin easing cycles.

Supporting Data and Foreign Exchange Dynamics

To fully understand the pressures facing the Bank of Japan, one must examine the broader macroeconomic data surrounding the Japanese yen and its relationship with the U.S. dollar. Foreign exchange markets have acted as a primary transmission channel for global economic shocks into the Japanese domestic economy.

本日、日銀は追加利上げか──円高は再開するのか、FOMC後のビットコインを待つ「二重の価格変動」【エックスウィン】 | NADA NEWS(ナダ・ニュース)

The depreciation of the yen has been exacerbated by the wide interest rate differential between Japan and the United States. While the Federal Reserve aggressively hiked rates to combat post-pandemic inflation, the BOJ maintained its accommodative stance for much longer. Even as the Fed signals potential rate cuts amid cooling U.S. labor markets, the lingering gap in borrowing costs continues to weigh on the Japanese currency.

Corporate Japan has expressed mixed reactions to a weaker yen. While export-oriented manufacturing giants benefit from higher overseas revenues when repatriated into yen, domestic-focused small and medium-sized enterprises (SMEs) struggle with surging import costs for raw materials and energy. This disparity has created a political imperative for policymakers to find a middle ground that supports the currency without choking off domestic consumption.

The Influence of U.S. Political and Monetary Shifts

Compounding the challenges facing Japanese monetary authorities is the unpredictable political and economic landscape in the United States. The potential return of Donald Trump to the White House has introduced a new layer of uncertainty into global financial markets. Administration proposals centered on protectionist trade policies, aggressive tariff structures, and fiscal expansion could reignite inflationary pressures in the U.S., potentially forcing the Federal Reserve to maintain higher-for-longer interest rates.

Such a scenario would likely keep the U.S. dollar strong, complicating the BOJ’s efforts to engineer a durable recovery for the yen. Financial markets are already pricing in the possibility of divergent monetary paths, where the BOJ attempts a slow, measured normalization while the Fed navigates its own domestic political pressures and economic indicators.

Furthermore, the intersection of traditional monetary policy with alternative asset classes, such as Bitcoin and digital currencies, has become an increasingly relevant topic for market analysts. As institutional adoption of crypto assets grows globally, Japanese investors are closely watching how regulatory changes and central bank liquidity trends impact risk appetite across both traditional and digital markets.

Broader Impact and Implications for the Japanese Economy

The ongoing debate over the BOJ’s policy path carries profound implications for various sectors of the Japanese economy:

  1. Consumer Impact: Households continue to bear the brunt of imported inflation. While nominal wages have shown signs of growth after decades of stagnation, real wages have often lagged behind price increases, constraining discretionary spending.
  2. Corporate Strategy: Corporations are being forced to adapt to a new paradigm where the cost of capital is no longer zero. Companies with strong balance sheets are better positioned to weather the transition, while heavily indebted firms face rising debt-servicing costs.
  3. Financial Sector: Regional banks and financial institutions are navigating the complexities of rising interest rates, which offer relief on net interest margins but introduce potential risks in fixed-income portfolios.

Ultimately, the question of whether the BOJ’s normalization path is adequate depends on a complex web of domestic wage growth, global commodity prices, and external monetary policy decisions. As the central bank moves forward, market participants will continue to scrutinize every policy statement and economic data release for clues about the future direction of Japanese monetary policy.

September 17, 2026 0 comment
0 FacebookTwitterPinterestEmail
Japanese & Asian Crypto Markets

SUSMED Announces the Successful Launch of its SourceDataSync (SDS) System for Clinical Trial Efficiency

by Nana Wu September 17, 2026
written by Nana Wu

On September 16, 2026, SUSMED, a prominent Japanese health-tech innovator, officially announced the deployment of its advanced clinical data integration system, SourceDataSync (SDS). This milestone represents a significant shift in how medical research organizations manage the complex, labor-intensive process of Source Data Verification (SDV) in clinical trials. By leveraging proprietary blockchain-based technology, the SDS system aims to streamline data validation, reduce human error, and accelerate the timeline for bringing life-saving therapies to market.

The launch of the SDS platform is particularly timely as the global pharmaceutical industry grapples with rising costs and the increasing complexity of clinical research. The integration of this system is expected to provide a robust solution for researchers who are tasked with maintaining rigorous data integrity while navigating strict regulatory requirements, such as Good Clinical Practice (GCP) guidelines.

The Problem: The Bottleneck of Clinical Trial Data Verification

At the heart of the clinical trial process lies the necessity of SDV—a meticulous and repetitive task where clinical research associates (CRAs) compare data recorded in a case report form against the original source documents, such as hospital medical records. Traditionally, this process is manual, prone to fatigue-related errors, and constitutes one of the largest time and financial burdens in the development of new drugs.

SUSMED’s research indicates that for many clinical trials, data verification can account for a substantial portion of the total study duration. Furthermore, the reliance on manual checks often forces researchers to focus more on administrative oversight than on patient outcomes or trial quality. With the introduction of the SDS system, SUSMED intends to move away from these legacy practices, shifting toward a model that prioritizes data accuracy through automated, verifiable, and immutable digital logs.

Technical Architecture and Operational Functionality

The SDS system functions by creating a digital bridge between a medical institution’s electronic health records (EHR) and the clinical trial’s data management systems. By utilizing blockchain technology, the platform ensures that data transmitted from the source remains tamper-proof and traceable throughout the trial lifecycle.

Key operational features of the SDS system include:

  • Real-time Synchronization: Data is pulled directly from clinical sources, reducing the latency between patient interaction and data entry.
  • Automated Validation: The system flags discrepancies between data points, allowing researchers to resolve errors instantly rather than weeks after the patient visit.
  • Immutable Audit Trails: Every modification to the data is recorded on the blockchain, providing a transparent and permanent audit trail that satisfies the most stringent regulatory inquiries.
  • Compliance Integration: The system is built to align with ICH-E6 (R3) guidelines, emphasizing Quality by Design (QbD) principles that ensure the trial is built for reliability from the outset.

Chronology of Development and Regulatory Milestones

SUSMED’s journey toward the commercialization of its SDS platform has been a multi-year effort involving rigorous testing and regulatory engagement.

  • June 2020: SUSMED officially announced the commencement of its research and development for the blockchain-integrated clinical data platform.
  • December 2020: The project received official recognition from the Ministry of Health, Labour and Welfare (MHLW), providing a path for the company to test its technology in real-world clinical environments.
  • November 2022: The company successfully concluded its Phase 3 clinical trial evaluation using the SDS platform, marking a pivotal moment in demonstrating that the technology could support large-scale, high-stakes medical research.
  • January 2023: Following the success of the Phase 3 trials, SUSMED secured formal regulatory approval for the use of the SDS system in specific therapeutic areas, validating its efficacy compared to traditional methods.
  • September 2026: The official public launch of the SDS system, making the technology available for wider adoption by research hospitals and pharmaceutical firms.

Impact Analysis: Efficiency Gains in Clinical Trials

The quantitative impact of the SDS system is substantial. According to data released by SUSMED during the launch, the implementation of SourceDataSync has led to a 45.9% improvement in operational efficiency during the data collection phase.

Other performance metrics shared by the company highlight a 32.0% increase in overall data management efficiency and a 46.7% reduction in monitoring costs. These figures represent a dramatic shift from the industry status quo. By cutting down the time spent on manual verification, clinical trial sponsors can redirect resources toward accelerating enrollment or expanding the scope of their research.

Furthermore, the system’s design addresses the critical "human factor." By removing the burden of manual data entry and cross-referencing, the system reduces the risk of fatigue-related errors—a common issue in long-term, multi-center trials where consistency across different geographical sites is difficult to maintain.

Industry Implications and Future Outlook

The adoption of the SDS system is positioned to influence the broader pharmaceutical landscape, particularly as regulators worldwide encourage the transition to digital-first research environments. The use of blockchain in this context is not merely a technical choice but a strategic one; it provides a "single source of truth" that is recognized by auditors and regulatory bodies as highly secure.

International standards, such as the GAMP 5 (Good Automated Manufacturing Practice) 2nd Edition, have paved the way for such innovations by providing a framework for computer system validation. SUSMED’s alignment with these standards ensures that the SDS system is not just an isolated tool but an enterprise-ready solution capable of scaling across global clinical research networks.

Looking ahead, SUSMED plans to continue refining the SDS system to support decentralized clinical trials (DCTs), which are increasingly popular in the post-pandemic era. By facilitating remote data monitoring and patient-centric data collection, the platform is expected to play a central role in the next generation of drug development.

Official Statements and Industry Reception

While the launch is an internal milestone for SUSMED, it has been met with interest from the broader health-tech community. Industry analysts noted that the successful integration of blockchain into a highly regulated environment like pharmaceutical research is a complex feat that requires deep expertise in both medical compliance and software architecture.

"The industry has been searching for a way to bridge the gap between hospital data silos and clinical trial requirements," remarked a industry spokesperson. "SUSMED’s SDS system provides a clear path forward, effectively replacing antiquated manual processes with a digital infrastructure that is both transparent and highly efficient."

As of September 2026, SUSMED is working with several major hospitals and research institutions to begin the rollout of the SDS system. The company expects that as more partners integrate the technology, the overall timeline for drug discovery will continue to contract, ultimately benefiting patients who are waiting for new therapeutic options.

The successful launch of the SDS system stands as a testament to the potential of emerging technologies to address long-standing challenges in healthcare. By transforming the way data is verified and managed, SUSMED has set a new benchmark for clinical research, demonstrating that the future of drug development lies in the intersection of medical science and secure, digital automation.

September 17, 2026 0 comment
0 FacebookTwitterPinterestEmail
Japanese & Asian Crypto Markets

Understanding Decentralized Finance: A Comprehensive Guide to the Foundations of Web3 Financial Infrastructure

by Ammar Sabilarrohman September 17, 2026
written by Ammar Sabilarrohman

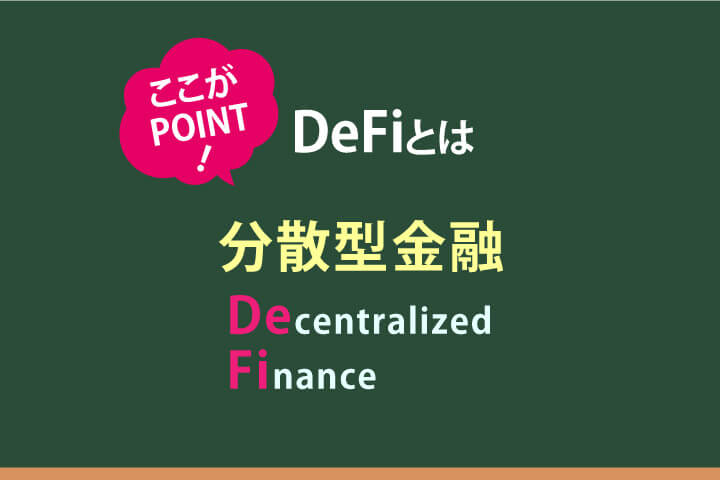
Decentralized Finance, widely referred to as DeFi, represents a paradigm shift in the global financial landscape, moving away from traditional centralized banking models toward a transparent, permissionless, and code-based ecosystem. At its core, DeFi leverages blockchain technology—primarily the Ethereum network and its smart contract capabilities—to facilitate financial transactions without the need for traditional intermediaries such as banks, brokerages, or clearinghouses. By utilizing automated protocols, DeFi seeks to democratize access to financial services, offering lending, borrowing, and trading capabilities to anyone with an internet connection and a digital wallet.

【3分でわかるWeb3.0講座】DeFiとは?特徴や注意点をわかりやすく解説

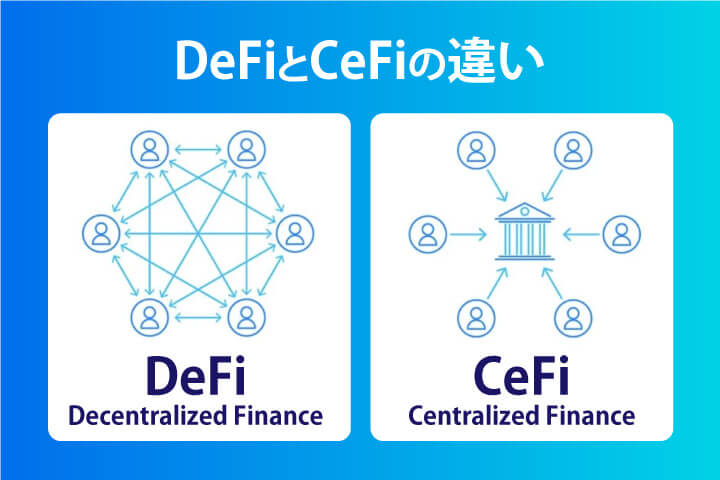
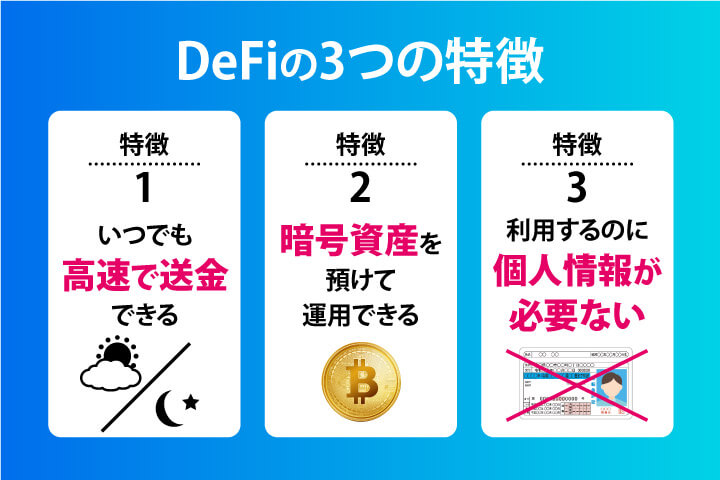
The emergence of DeFi is intrinsically linked to the broader evolution of Web3, a vision for a decentralized internet where users maintain sovereignty over their data and assets. While traditional finance (CeFi) relies on institutional trust and human oversight, DeFi operates through open-source code. This shift allows for 24/7 global operations, reducing the reliance on legacy banking hours and geographic restrictions. As the ecosystem matures, it is increasingly being integrated into various digital sectors, including GameFi and decentralized autonomous organizations (DAOs), creating a more interconnected and efficient digital economy.

The Fundamental Mechanics and Structural Differences: DeFi vs. CeFi

【3分でわかるWeb3.0講座】DeFiとは?特徴や注意点をわかりやすく解説

To understand the impact of DeFi, one must distinguish it from Centralized Finance (CeFi). In a CeFi environment, institutions act as custodians of assets, requiring users to undergo rigorous identity verification (KYC) and adhere to centralized control mechanisms. While this provides a layer of institutional security and legal recourse, it also creates single points of failure and restricts access for the unbanked or underbanked populations.

In contrast, DeFi protocols are governed by smart contracts—self-executing code that automatically enforces the terms of an agreement once specific conditions are met. This structural design removes the need for a middleman to authorize transactions. For instance, in a decentralized lending protocol, a user can deposit cryptocurrency as collateral and borrow another asset instantly, provided the smart contract’s liquidity requirements are met. This process is transparent, verifiable on the public blockchain, and immune to human bias or administrative delay.

【3分でわかるWeb3.0講座】DeFiとは?特徴や注意点をわかりやすく解説

Historical Context and the Rise of Decentralized Exchanges

The trajectory of the DeFi movement gained significant momentum around 2020, often referred to as "DeFi Summer." During this period, the introduction of yield farming and liquidity mining incentivized users to provide capital to decentralized platforms. Among the most critical innovations of this era were Decentralized Exchanges (DEXs), such as Uniswap, which revolutionized how digital assets are traded.

【3分でわかるWeb3.0講座】DeFiとは?特徴や注意点をわかりやすく解説

Unlike traditional exchanges that use order books managed by a central operator, DEXs employ Automated Market Makers (AMMs). AMMs utilize liquidity pools—large caches of tokens locked in smart contracts—to facilitate trades. This model ensures that as long as there is liquidity in the pool, users can swap assets at any time without needing a counterparty to match their order. This innovation significantly increased market efficiency and paved the way for more complex financial products, including derivatives, synthetic assets, and insurance protocols.

Key Benefits and Operational Advantages

【3分でわかるWeb3.0講座】DeFiとは?特徴や注意点をわかりやすく解説

The primary appeal of DeFi lies in its efficiency and accessibility. Because these systems are automated, they can function continuously, providing users with the ability to manage their portfolios regardless of their location or time zone. Furthermore, the global nature of these protocols allows for the rapid deployment of capital. When a user interacts with a DeFi protocol, they are engaging with an global liquidity pool, which often results in more competitive pricing compared to isolated, centralized silos.

Another significant advantage is the transparency afforded by public ledgers. Every transaction, interest rate adjustment, and liquidity movement is recorded on the blockchain. While this does not eliminate risk, it provides users and auditors with real-time data to assess the health of a protocol. This level of visibility is unprecedented in traditional finance, where much of the underlying activity remains obscured within institutional balance sheets.

【3分でわかるWeb3.0講座】DeFiとは?特徴や注意点をわかりやすく解説

Challenges and Risk Factors in the DeFi Ecosystem

Despite its rapid growth, DeFi is not without significant risks. The reliance on smart contracts means that any vulnerability in the code can be exploited, leading to substantial losses. Unlike traditional bank accounts, which may be protected by deposit insurance, assets in DeFi protocols are generally non-custodial and carry the risk of total loss if a protocol is compromised.

【3分でわかるWeb3.0講座】DeFiとは?特徴や注意点をわかりやすく解説

Security audits are a standard practice in the industry, yet they do not guarantee immunity from sophisticated exploits. Furthermore, the volatility of underlying assets can lead to rapid liquidations for borrowers, especially in highly leveraged positions. Regulatory uncertainty remains another major hurdle; as governments worldwide grapple with how to classify and tax decentralized assets, developers and users face a shifting landscape of compliance requirements.

The Role of Liquidity and Total Value Locked (TVL)

【3分でわかるWeb3.0講座】DeFiとは?特徴や注意点をわかりやすく解説

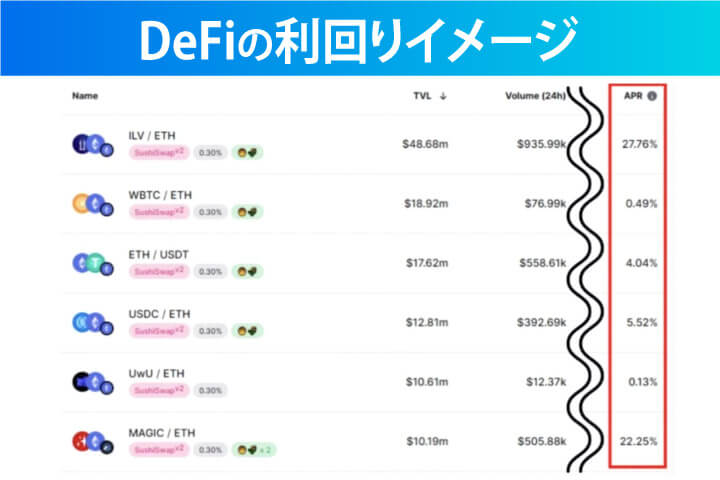
A primary metric for evaluating the success and stability of a DeFi project is Total Value Locked (TVL). TVL represents the aggregate sum of all assets currently deposited within a protocol’s smart contracts. A high TVL generally indicates a higher level of trust and utility, as it reflects the amount of capital that users are willing to entrust to the system.

However, users must exercise caution when interpreting these metrics. High TVL can sometimes be a result of aggressive token incentives that may not be sustainable over the long term. A robust protocol is one that demonstrates consistent volume, a diverse user base, and a clear utility beyond speculative yield generation. As the market continues to evolve, the focus is shifting toward "real yield"—returns generated from actual protocol activity and transaction fees rather than inflationary token emissions.

【3分でわかるWeb3.0講座】DeFiとは?特徴や注意点をわかりやすく解説

The Integration of DeFi into Gaming and Beyond

One of the most promising applications of DeFi is its integration into GameFi, where in-game assets are tokenized and can be traded on decentralized secondary markets. By incorporating DeFi mechanics, game developers can create sustainable economies where players truly own their digital assets and can earn rewards for their participation.

【3分でわかるWeb3.0講座】DeFiとは?特徴や注意点をわかりやすく解説

This integration represents the "financialization" of gaming, providing players with tangible economic incentives that extend beyond the virtual environment. As cross-chain interoperability improves, it is likely that we will see assets moving seamlessly between different gaming ecosystems and DeFi protocols, further blurring the lines between leisure and financial activity.

Future Outlook and Institutional Adoption

【3分でわかるWeb3.0講座】DeFiとは?特徴や注意点をわかりやすく解説

The long-term success of DeFi will depend on balancing the ethos of decentralization with the need for user security and regulatory clarity. We are already observing an increase in institutional interest, with traditional financial firms exploring "Permissioned DeFi"—protocols that allow for the benefits of blockchain efficiency while maintaining compliance with identity and regulatory standards.

As infrastructure matures, we can expect to see improvements in user interfaces, making these complex financial tools more accessible to the average consumer. Education remains a critical component; as users become more sophisticated in their understanding of smart contracts and wallet security, the risks associated with the ecosystem will likely decrease.

【3分でわかるWeb3.0講座】DeFiとは?特徴や注意点をわかりやすく解説

In summary, DeFi is not merely a trend but a fundamental restructuring of how value is moved and managed in a digital-first world. While the risks are real and the technology is still in its relative infancy, the core value proposition of a permissionless, transparent, and global financial system is too significant to ignore. As the industry continues to iterate and improve, DeFi will likely serve as the bedrock for a new era of digital finance, one that is built on code, governed by users, and accessible to everyone.

September 17, 2026 0 comment
0 FacebookTwitterPinterestEmail
Crypto Mining & Infrastructure

Hashrate Index Newsletter: Navigating the Evolving Landscape of Bitcoin Mining Infrastructure and Market Dynamics

by Nila Kartika Wati September 17, 2026
written by Nila Kartika Wati

The Bitcoin mining industry has transitioned from a niche pursuit for hobbyists into a multi-billion dollar sector defined by institutional-grade infrastructure, complex energy arbitrage, and high-stakes market volatility. As the sector matures, the demand for timely, data-driven intelligence has become paramount for stakeholders ranging from public mining firms to individual hardware operators. The Hashrate Index Newsletter serves as a critical conduit for this information, aggregating the metrics that define the health of the network. By examining the current state of hashprice, network difficulty, and energy procurement strategies, observers can better understand the forces shaping the security and economic viability of the Bitcoin blockchain.

The Evolution of Mining Intelligence

In the early days of Bitcoin, mining was largely a decentralized activity performed by individuals using general-purpose computing hardware. As the network grew, the transition to Application-Specific Integrated Circuits (ASICs) necessitated a shift toward industrial-scale data centers. This evolution brought about a requirement for professionalized reporting. The Hashrate Index was conceived to fill the information vacuum left by traditional financial news outlets, which often lacked the granular data necessary to track metrics such as hashprice—a composite indicator representing the expected daily revenue per terahash per second (TH/s) of computing power.

The necessity of such newsletters is underscored by the cyclical nature of the industry. Mining profitability is inherently tied to three volatile variables: the Bitcoin price, the network difficulty, and the cost of electricity. When the network difficulty increases, miners must deploy more efficient hardware or secure cheaper energy to maintain the same margin. Consequently, stakeholders who monitor these indices are better positioned to make capital expenditure decisions regarding equipment procurement and site expansion.

Chronology of Network Growth and Difficulty Adjustments

To understand the current state of the mining market, one must examine the progression of the network’s difficulty. Since the inception of Bitcoin in 2009, the difficulty—a measure of how hard it is to find a hash below a given target—has undergone thousands of adjustments. These adjustments occur roughly every two weeks, or every 2,016 blocks, ensuring that the average block time remains approximately 10 minutes regardless of the total network hashrate.

The post-2020 era saw an unprecedented surge in network difficulty, fueled by the migration of global mining operations following regulatory shifts in major jurisdictions. In 2021, the industry witnessed a significant "great migration," where miners moved from concentrated regions to more hospitable climates in North America and Central Asia. This period necessitated a more robust approach to data tracking, as the distribution of hashrate became a matter of geopolitical and energy-market interest. Newsletters like the Hashrate Index provide the essential documentation for these shifts, allowing analysts to track the movement of power from one region to another as energy policies evolve.

Supporting Data and Market Metrics

The metrics tracked by industry professionals are multifaceted. Chief among these is the "Hashprice," which serves as the industry’s barometer for profitability. Hashprice accounts for the total block subsidy and transaction fees, divided by the network hashrate. Historically, this figure has been inversely correlated with network difficulty—as more miners join the network, the difficulty rises, effectively diluting the rewards for each individual operator.

Supporting data suggests that the average efficiency of the global mining fleet has improved drastically. In 2018, the industry standard for mining efficiency was measured in the range of 80 to 100 Joules per Terahash (J/TH). Modern equipment, such as the latest generation of air-cooled and immersion-cooled ASICs, has pushed this efficiency toward the 20 J/TH threshold. This technological leap has allowed miners to remain profitable even during periods of suppressed asset prices, effectively creating a "floor" for operational viability.

Furthermore, the integration of Bitcoin mining with renewable energy projects has become a focal point of recent data analysis. Research indicates that miners are increasingly serving as "flexible load" resources for power grids, balancing the intermittency of wind and solar energy. By capturing "stranded" energy—excess power that cannot be transmitted to population centers—miners are changing the economics of energy infrastructure. Tracking these developments requires a sophisticated understanding of power purchase agreements (PPAs) and grid load management, areas frequently covered in specialized industry newsletters.

Official Responses and Institutional Perspectives

The institutionalization of Bitcoin mining has drawn comments from various stakeholders, including energy executives, environmental regulators, and public company executives. In recent parliamentary and congressional hearings, industry leaders have emphasized the dual role of mining as a grid stabilizer and a driver for infrastructure development.

Publicly traded mining companies, which are required to disclose their operational metrics to shareholders, have consistently noted that the volatility of the mining market necessitates a long-term hedging strategy. Executives often highlight that access to real-time data—the kind synthesized in newsletters—is vital for executing these strategies. "The ability to monitor network difficulty in real-time allows us to optimize our machine deployment schedule," stated one industry representative in a recent panel discussion. "Without these indicators, capital allocation would be akin to flying blind in a high-velocity market."

Regulatory bodies, while cautious, have also begun to acknowledge the role of mining data in environmental reporting. As miners are increasingly asked to provide transparency regarding their energy sources, the availability of comprehensive industry indices has provided a baseline for factual discussion. These indices allow for an objective assessment of the industry’s carbon footprint, moving the conversation away from speculation and toward verifiable energy consumption data.

Broader Impact and Economic Implications

The broader implications of a data-informed mining sector are significant. As mining becomes a more competitive industry, the barrier to entry rises, favoring entities that can secure the most efficient hardware and the lowest electricity rates. This creates a natural selection process that drives innovation in cooling technology, power conversion, and semiconductor design.

From a macroeconomic perspective, Bitcoin mining is increasingly viewed as a mechanism for the monetization of energy. By converting electricity into digital value, miners provide a constant demand for energy that supports the development of new generation capacity. This has a multiplier effect on local economies, particularly in regions where energy production is high but local demand is low. The newsletter format acts as an educational tool, disseminating these economic realities to a wider audience, including investors who are new to the intersection of energy markets and digital assets.

Moreover, the resilience of the Bitcoin network is directly tied to the health of the mining ecosystem. A well-informed mining community is more likely to respond rationally to market downturns, preventing the type of catastrophic "capitulation" events that could threaten the network’s hash security. By providing consistent updates on mining hardware cycles and energy costs, the Hashrate Index ensures that the market participants have the information required to sustain the network through various cycles.

Future Outlook and Conclusion

Looking ahead, the mining industry faces several challenges and opportunities. The transition to post-halving economics, where miners rely more heavily on transaction fees than block subsidies, will require even greater precision in operational management. As transaction volume on the Bitcoin blockchain grows—driven by new protocols and layer-two solutions—the profitability models for miners will continue to shift.

The Hashrate Index Newsletter and similar initiatives play a foundational role in this environment. By democratizing access to complex mining data, they empower a broader range of participants to engage with the network. As the industry continues to integrate with global energy markets, the role of objective, fact-based reporting will only grow in importance. For those involved in the sector, the subscription to such a newsletter is not merely a request for news; it is a commitment to maintaining the operational awareness necessary to navigate the future of decentralized finance.

In summary, the maturity of the Bitcoin mining industry is reflected in the sophistication of its analytical tools. From the early, uncertain days of amateur mining to the current era of institutional energy management, the industry has demonstrated a remarkable capacity for growth and adaptation. By continuing to track the vital statistics of the network—hashprice, difficulty, and energy efficiency—stakeholders can continue to support the security and growth of the world’s most robust decentralized network. As we move further into the digital age, the convergence of energy, technology, and finance will continue to be documented by these essential informational resources, providing the clarity needed to navigate a rapidly changing landscape.

September 17, 2026 0 comment
0 FacebookTwitterPinterestEmail
Crypto Mining & Infrastructure

Massachussets Authorities Issue Arrest Warrant For Former Municipal Employee Over Covert High School Crypto-Mining Operation

by Dwi Wanna September 17, 2026
written by Dwi Wanna

The Massachusetts judicial system has escalated legal proceedings against Nadeem Nahas, a former municipal facilities worker accused of orchestrating an elaborate, covert cryptocurrency-mining operation tucked deep within the infrastructure of a public high school. According to court documents and local law enforcement reports, Nahas allegedly siphoned nearly $18,000 worth of municipal electricity to power a bank of specialized computers humming continuously beneath Cohasset High School. Following his failure to appear for a scheduled court arraignment, a local judge has issued a default warrant for his arrest, marking a significant development in a case that first came to light more than a year prior.

The clandestine operation highlights an escalating intersection between municipal governance, illicit resource diversion, and the high-energy demands of digital asset mining. As public scrutiny over the environmental and financial costs of cryptocurrency mining intensifies across the United States, incidents involving the unauthorized use of public infrastructure have transitioned from isolated curiosities to serious criminal matters prosecuted under municipal theft and property damage statutes.

Chronology of the Cohasset High School Mining Operation

The unfolding of the Cohasset crypto-mining scheme spans a multi-year timeline involving municipal discovery, internal investigations, police intervention, and subsequent judicial proceedings.

Between April 28 and December 14, 2021, the unauthorized mining hardware operated virtually uninterrupted. Placed strategically in a damp, secluded crawl space near the boiler room in the basement of Cohasset High School, the 11 specialized computers ran 24 hours a day, seven days a week. The constant heavy electrical load and the residual heat generated by the machines went largely unnoticed by daily school operations, obscured by the cavernous layout of the building’s utility infrastructure.

The operation was ultimately exposed on December 14, 2021. During a routine facility check, the high school’s facilities director stumbled upon unusual wiring, network cables, and unassigned computing hardware humming away in the subterranean crawl space. Recognizing that the equipment did not belong to the school district or any authorized municipal IT contractor, the director immediately alerted local law enforcement.

Following the initial report, the Cohasset Police Department launched a comprehensive three-month investigation. Investigators mapped the electrical routing to determine how the miners were plugged into the school’s power grid and traced the hardware back to Nahas, who at the time was employed within the Cohasset town facilities department.

By March 2022, as the investigation closed in, Nahas resigned from his position with the town. Law enforcement subsequently filed formal criminal charges against him, calculating the total loss of taxpayer-funded electricity at $17,492.57. However, the legal process suffered a setback when Nahas failed to attend a mandatory court hearing. This non-appearance prompted the presiding judge to issue a default warrant, authorizing police across the jurisdiction to locate, detain, and bring him before the court to face the charges.

Authorities Uncover Crypto Mine Hidden Under A School | Bitcoinist.com

Financial and Operational Scale of the Subterranean Rig

The technical footprint of the Cohasset operation was relatively modest compared to industrial-scale mining facilities found in former warehouses or specialized data centers, yet its impact on a local municipal budget was substantial.

Investigators seized a total of 11 dedicated mining computers from the crawl space beneath the high school. These devices—typically equipped with high-performance Application-Specific Integrated Circuits (ASICs) or powerful graphics processing units (GPUs)—are designed to execute complex cryptographic algorithms continuously in exchange for block rewards in digital currencies such as Bitcoin.

The financial damage to the town of Cohasset was meticulously calculated by municipal utility analysts. By cross-referencing the power draw of the specific hardware models recovered against local commercial electricity rates over the roughly seven-month operational window, officials determined that the rigs consumed thousands of kilowatt-hours of electricity. Because the equipment was plugged directly into the school’s master electrical circuit, the cost of powering the operation fell entirely upon local taxpayers, subsidizing private digital asset generation at public expense.

Global Parallels: Illicit Crypto Mining and Resource Theft

While the location of the Cohasset mining rig inside a public school crawl space added a bizarre element to the case, the underlying crime—stealing municipal or commercial electricity to power energy-intensive crypto operations—is a growing global phenomenon. Law enforcement agencies worldwide have increasingly encountered similar illicit setups as the profitability of digital currencies fluctuates.

In July 2021, Malaysian authorities executed a massive crackdown on illegal cryptocurrency mining operations that had been siphoning millions of dollars in electricity from regional power grids. In a dramatic display intended to deter similar offenses, local police seized over 1,000 Bitcoin mining rigs and utilized a heavy industrial steamroller to crush and destroy the hardware in public view. The operation underscored the physical destruction that governments are willing to inflict upon unauthorized mining equipment.

Similarly, in August 2020, Bulgarian law enforcement dismantled two large clandestine cryptocurrency farms operating in the capital city of Sofia. Investigators discovered that the operators had illegally tapped directly into commercial power lines, bypassing standard utility meters to siphon more than $1.5 million worth of electricity over a period of three to six months.

These international cases illustrate that the immense energy requirements of proof-of-work mining networks often incentivize bad actors to seek out subsidized, unmetered, or outright stolen power sources to maximize their profit margins, frequently shifting the financial burden onto utility companies, municipalities, or unsuspecting property owners.

Authorities Uncover Crypto Mine Hidden Under A School | Bitcoinist.com

Broader US Regulatory and Environmental Concerns

The Cohasset incident coincides with a broader, intense national debate in the United States regarding the environmental footprint, grid stability, and energy consumption associated with the cryptocurrency mining sector. Federal lawmakers and regulatory agencies have increasingly scrutinized the industry, demanding greater transparency and accountability from operators.

In early 2023, a coalition of eight prominent U.S. lawmakers—including vocal cryptocurrency critic Senator Elizabeth Warren and Representative Jared Huffman—sent formal letters to the Environmental Protection Agency (USEPA) and the Department of Energy (DOE). The congressional correspondence expressed deep concern over the rapid proliferation of energy-intensive crypto-mining facilities across the United States and the resultant strain on regional power grids.

The lawmakers formally requested that the EPA and DOE implement mandatory, comprehensive data collection and public disclosure requirements for crypto-mining operations. Their primary objectives were to measure the exact amount of energy consumed by the sector, assess its contribution to greenhouse gas emissions, and evaluate its impact on local communities striving to meet climate goals.

Representative Huffman emphasized in public statements that the unregulated pollution and massive energy demands of digital asset mining present an urgent environmental threat. By pushing federal agencies to enforce strict transparency rules, lawmakers aim to curb practices that compromise local power infrastructure and exacerbate carbon emissions.

Implications and Legal Precedents

The case of Nadeem Nahas serves as a cautionary tale for municipalities and public institutions regarding physical security and infrastructure oversight. Public buildings, schools, and municipal offices contain vast networks of utility rooms, crawl spaces, and electrical panels that are frequently accessed by maintenance personnel. Without strict access controls, inventory tracking, and energy consumption monitoring, public assets remain vulnerable to insider exploitation.

From a legal standpoint, the charges against Nahas extend far beyond simple trespassing or property misuse. Stealing thousands of dollars in utilities from a municipal government entity carries severe felony penalties, particularly when the theft involves public educational institutions funded by local taxpayers. The issuance of the default warrant ensures that the judicial process will move forward, setting a legal precedent for how American courts handle the intersection of municipal resource theft and unauthorized cryptocurrency operations.

As legal authorities continue their search for Nahas, the case remains a striking reminder of the lengths to which some individuals will go to exploit cheap or free energy sources in pursuit of digital currency, and the growing determination of law enforcement agencies to hold perpetrators accountable.

September 17, 2026 0 comment
0 FacebookTwitterPinterestEmail
Global Cryptocurrency News

MEXC July-August 2026 Security Report Reveals 38.66 Million USDT in Intercepted Risk Funds and a Surge in Cross-Platform Defense Measures

by Suro Senen September 16, 2026
written by Suro Senen

The global digital asset ecosystem continues to navigate a complex and evolving threat landscape, marked by increasingly sophisticated cyberattacks, the growing integration of artificial intelligence by malicious actors, and heightened regulatory scrutiny regarding platform solvency and user protection. Within this dynamic environment, major centralized cryptocurrency exchanges carry a profound responsibility to safeguard customer capital while maintaining absolute transparency regarding operational reserves and risk mitigation protocols. Addressing these pressing industry demands, digital asset trading platform MEXC released its comprehensive security and reserves report covering the months of July and August 2026. The bi-monthly publication outlines significant advancements in the platform’s security infrastructure, detailing the successful interception of millions of dollars in illicitly obtained capital, a substantial expansion of its Futures Insurance Fund, and the maintenance of robust proof-of-reserve metrics across key digital currencies.

The Broad Threat Landscape: AI-Driven Exploits and Industry-Wide Vulnerabilities

During the July-August 2026 reporting window, the global cryptocurrency sector experienced a challenging period marked by numerous high-profile security incidents. Industry-wide data compiled during these two months indicates that malicious actors executed a total of 184 distinct security breaches and exploits, resulting in aggregate reported losses of approximately $535 million. A granular examination of these incidents reveals shifting methodologies among cybercriminals, with phishing scams, fraudulent social engineering schemes, endpoint vulnerabilities, and supply-chain compromises accounting for roughly 48 percent of all recorded breaches.

Compounding these traditional attack vectors is the rapid operational evolution observed among cybercriminal syndicates. Security analysts have noted an alarming trend wherein threat actors increasingly leverage generative artificial intelligence to automate the creation of convincing phishing content, draft sophisticated malware variants, and execute large-scale social engineering campaigns with unprecedented efficiency. As digital asset adversaries diversify their tactics, individual platforms face mounting pressure to implement proactive countermeasures. Swift identification of suspicious fund movements, rigorous cross-platform intelligence sharing, and seamless coordination with international law enforcement agencies have thus emerged as vital prerequisites for minimizing systemic user losses and preserving ecosystem stability.

Intercepting Illicit Capital: Operational Metrics from July and August 2026

Amid this volatile backdrop, MEXC’s security and risk-management divisions reported a dramatic escalation in defensive operations. Throughout July and August, the platform assisted in tracking and handling 215 distinct external reports involving stolen, compromised, or fraud-related funds attempting to infiltrate its trading environment. In a testament to the efficacy of the exchange’s automated monitoring systems and investigative protocols, 100 percent of these 215 cases were successfully intercepted.

The total monetary value of the risk-related funds intercepted during this two-month period amounted to approximately 38,655,490 USDT. Of these successfully managed cases, 42 involved direct collaboration with judicial authorities to execute formal asset freezes. When measured against the preceding reporting period, these figures represent an exponential expansion in threat mitigation capacity: the number of successfully intercepted cases surged by approximately 2,971 percent, while the absolute financial value of the blocked assets registered an increase of approximately 12,646 percent.

This dramatic scaling of intercepted capital is attributed not only to the rising volume of external threats but also to enhanced collaborative frameworks. In managing these investigations, MEXC actively shared suspicious wallet addresses and transaction signatures with major industry stakeholders, facilitating cross-platform tracking of fund flows. These efforts were reinforced by standardized joint-investigation procedures and formal channels of cooperation with international law enforcement bodies, ensuring that illicit actors find fewer safe harbors within the centralized exchange network.

Account Restrictions, Regional Risk Concentrations, and Asset Recovery

Beyond intercepting external inflows of compromised capital, MEXC’s internal risk surveillance systems targeted suspicious behavior directly within the platform’s user base. During the July-August window, the exchange identified and systematically restricted 20,752 accounts associated with various risk-related activities, representing a 118.03 percent increase compared to the previous evaluation period.

Furthermore, platform analytics detected 5,288 distinct risk groups—representing syndicated or coordinated fraudulent operations—marking a 20.35 percent rise. Geographic profiling of these identified risk groups highlighted specific regional concentrations, providing valuable intelligence for global compliance and anti-money laundering (AML) operations. The primary geographic origins of these risk groups were concentrated within the Commonwealth of Independent States (CIS) with 1,803 identified groups, followed by Nigeria with 1,099 groups, and Indonesia with 976 groups.

In parallel with defensive restrictions, MEXC continued to prioritize user restitution for accidental transfer errors and misdirected funds. Through manual administrative processing, the platform’s support and security teams handled 818 user applications for the return of misdirected assets. This resulted in the successful recovery and return of funds equivalent to 602,225 USDT to rightful owners, demonstrating a 75.31 percent increase in processed recovery volume compared to the previous period.

Bolstering Solvency Buffers: Futures Insurance Fund and Proof of Reserves

While threat interception and account monitoring form the front line of defense, long-term user security relies equally on robust financial buffers and transparent solvency proofs. As of September 1, 2026, the total balance of the MEXC Futures Insurance Fund reached 791,696,422 USDT. This figure represents a 5.44 percent expansion from the previous reporting interval, providing a deep financial cushion designed to absorb negative balances that may arise during extreme market liquidations.

The Futures Insurance Fund plays a critical stabilizing role during periods of high market volatility, acting as a buffer to prevent systemic failure and significantly reducing the necessity for auto-deleveraging (ADL) mechanisms that impact profitable traders. Under the platform’s operational guidelines, when a liquidated futures position is successfully closed at a price superior to its theoretical bankruptcy price, the resulting surplus is funneled directly into the insurance fund. To ensure absolute transparency, MEXC provides users with real-time balance tracking via its official Proof of Trust portal.

Complementing the derivatives insurance buffer, MEXC’s latest proof-of-reserves audit confirms that the exchange maintains a fully backed financial posture across all major digital asset categories. Throughout the reporting period, reserve ratios for the four primary benchmark assets—Bitcoin (BTC), Ethereum (ETH), Tether (USDT), and USD Coin (USDC)—remained comfortably above the 100 percent threshold. Notably, the reserve ratio for Bitcoin stood at approximately 288 percent, ensuring that customer holdings are backed by substantial over-collateralization.

To dispel any opacity regarding custodial solvency, MEXC has publicly disclosed the specific on-chain wallet addresses holding these reserve assets. Users can independently verify the security and backing of their individual account balances by utilizing cryptographic Merkle Tree verification tools provided on the platform, allowing clients to independently audit the exchange’s solvency claims without relying solely on corporate assurances.

The Guardian Fund and Long-Term Institutional Commitments

As an additional, multi-layered layer of protection for retail and institutional participants, MEXC continues to maintain and expand its dedicated Guardian Fund. Designed to act as an emergency reserve pool for extraordinary market events and unforeseen systemic disruptions, the Guardian Fund utilizes a sophisticated dual-reserve asset structure composed of USDT and BTC. Within this architecture, USDT provides immediate, high-liquidity capital support for rapid emergency response, while Bitcoin serves as a stable, long-term reserve asset capable of preserving value across broad cryptocurrency market cycles.

In alignment with its strategic roadmap to fortify user protection infrastructure, MEXC has announced plans to aggressively scale the Guardian Fund from its baseline of $100 million to a substantial target of $500 million. The designated on-chain wallet addresses for the Guardian Fund remain publicly accessible for independent tracking, reinforcing the platform’s dedication to radical transparency.

Addressing the broader implications of the bi-monthly report, MEXC CEO Vugar Usi emphasized the foundational importance of trust within the modern digital asset economy, framing transparency and rapid intervention as absolute prerequisites for sustainable industry growth.

"Trust is the true reserve currency of this industry," stated Usi. "Protecting user assets means moving decisively the moment risk emerges, while giving users something they can verify for themselves, not just our word for it. We will continue to strengthen our ability to identify and intercept risk-related funds, deepen cooperation across platforms and with law enforcement, and help affected users recover their losses wherever possible. Our bi-monthly security reports are part of that commitment, allowing our security performance to be measured and tracked over time."

Implications for the Digital Asset Ecosystem

The data and operational disclosures presented in MEXC’s July-August 2026 security report offer critical insights into the current trajectory of centralized exchange security. As malicious actors increasingly adopt artificial intelligence and automated exploitation frameworks, the cybersecurity arms race within the blockchain sector has entered a new phase. Standalone security measures implemented by individual trading venues are no longer sufficient to completely insulate users from sophisticated, cross-border financial crimes.

The dramatic increase in intercepted funds reported by MEXC—evidenced by the multi-thousand-percent growth in both blocked case volume and aggregate monetary value—highlights both the escalating scale of external threats and the growing efficacy of cooperative industry defense mechanisms. By institutionalizing bi-monthly transparency reports, opening reserve addresses to cryptographic Merkle Tree verification, and expanding multi-million-dollar safety reserves like the Guardian Fund and Futures Insurance Fund, the exchange industry is steadily establishing higher standards of accountability. These developments suggest that future industry resilience will depend heavily on automated risk analytics, real-time cross-platform intelligence sharing, and uncompromising public solvency disclosures.

About MEXC

Founded in 2018, MEXC has established itself as a leading global multi-asset trading platform engineered to serve as a zero-fee gateway to diverse financial opportunities. Operating across more than 170 markets worldwide, the platform delivers streamlined, efficient access to spot cryptocurrencies, traditional equities, tokenized real-world assets, derivatives, and an expanding suite of traditional finance (TradFi) linked products through a unified account structure.

Characterized by zero trading fees, deep market liquidity, extensive asset diversity, and a high-performance execution engine, MEXC is purpose-built for retail participants seeking early asset discovery and efficient execution. As the traditional financial and digital asset sectors continue their structural convergence, MEXC remains dedicated to reducing trading barriers, enhancing global liquidity access, and providing the robust security infrastructure necessary for users to navigate the modern financial landscape securely.

September 16, 2026 0 comment
0 FacebookTwitterPinterestEmail
Bitcoin & Core Networks

Retreshed Bitcoin Roadmap by Analyst Klarck Gains Market Attention as Price Nears Critical Downside Target Zone

by Ammar Sabilarrohman September 16, 2026
written by Ammar Sabilarrohman

Financial markets have long relied on technical analysis, historical pricing models, and cyclical roadmaps to navigate the notoriously volatile cryptocurrency sector. Among these analytical assets, a previously published Bitcoin roadmap drafted by prominent crypto commentator Klarck in February has recently re-entered public discourse. The renewed interest is not born from a fresh, real-time market update or a newly issued trading signal, but rather from the simple reality that Bitcoin’s recent price trajectory has brought the leading digital asset dangerously close to one of the critical downside zones outlined in Klarck’s original projection months prior.

When the roadmap was initially shared on the social media platform X, its ambitious targets and severe retracement zones generated considerable debate. Technical analysis often relies on multi-stage hypotheses that encompass bullish expansions, corrective contractions, consolidation periods, and eventual macro breakouts. Klarck’s thesis was no exception, charting a complex path that envisioned an initial local relief bounce toward the $83,000 threshold, followed by a deeper, more punishing market correction pulling the asset down into the $65,000 to $55,000 range. Beyond this correction, the roadmap anticipated a sustained two-week accumulation phase designed to wash out leveraged positions, eventually laying the foundation for a massive structural recovery toward an ultimate cycle target of $140,000 per Bitcoin.

As market conditions evolve and price action begins to mirror the preliminary downward stages of this speculative trajectory, traders, analysts, and retail participants alike are dusting off the old chart. This phenomenon highlights a broader psychological trend within financial markets: when price action validates even a portion of an older forecast, market participants routinely revisit the source material to gauge whether the subsequent steps of the thesis might also hold true. However, financial analysts emphasize a crucial distinction between market validation and absolute prediction. The fact that Bitcoin has descended toward the upper boundaries of the predicted corrective zone does not inherently validate the accuracy of the entire roadmap, nor does it guarantee that the asset will successfully bounce, accumulate, or ultimately surge toward the lofty $140,000 milestone.

Chronology and Evolution of the Forecast

To understand why this specific roadmap is regaining traction, it is necessary to examine the chronological sequence of events surrounding its publication and the subsequent behavior of the cryptocurrency market. In the weeks following the initial February post, Bitcoin experienced the fluid, high-velocity price swings that have historically characterized its market cycles. At the time of the post, prevailing market sentiment was deeply intertwined with macroeconomic factors, shifting regulatory landscapes, and fluctuating institutional inflows via spot exchange-traded funds (ETFs).

Klarck’s projection did not immediately capture mainstream attention because it flew in the face of prevailing short-term euphoria. While many commentators were hyper-focused on immediate all-time-high breakouts, the roadmap mapped out a methodical, painful corrective phase. It argued that a direct, uninhibited march upward was statistically improbable without a significant cleansing of market leverage. The first phase—the anticipated relief bounce toward $83,000—acted as an initial testing ground for bullish momentum. Once that local peak was established, the market began to carve out the gradual downward slope envisioned in the analysis.

Months later, as broader macroeconomic headwinds, liquidity contractions, and shifting derivatives markets exerted downward pressure on digital assets, Bitcoin began trading closer to the upper parameters of the $65,000 to $55,000 downside zone. This convergence of price and projection transformed an overlooked historical social media post into a focal point for technical traders seeking contextual reference points. Rather than treating the roadmap as a crystal ball, seasoned market participants are utilizing it as an intellectual framework to observe how current support and resistance levels interact with previously mapped liquidity pockets.

Deconstructing the Critical $65,000 to $55,000 Support Band

At the core of the revived discussion is the identified price band ranging from $65,000 down to $55,000. When Bitcoin is trading significantly higher than a projected corrective floor, forecasts pointing toward steep double-digit percentage drops are frequently dismissed by bullish market participants as fear-mongering or overly pessimistic technical maneuvering. Yet, as price action systematically erodes previous gains and inches closer to those once-dismissed thresholds, the psychological weight of the zone increases exponentially.

Within technical analysis, a zone of this magnitude is rarely a razor-thin line on a chart; rather, it represents a dense cluster of liquidity, historical volume nodes, and institutional cost bases. If Bitcoin establishes a firm foothold and stabilizes within the upper limits of this bracket, it could signal the beginning of the accumulation phase outlined in the February roadmap. An authentic accumulation phase typically requires specific structural behaviors from the market: the cessation of lower lows, the tightening of daily volatility ranges, and a noticeable decrease in aggressive selling pressure from leveraged market participants.

Conversely, if the upper boundary of this crucial zone fails to hold, the market dynamic shifts dramatically. Traders and algorithmic execution models will immediately turn their attention to the lower end of the range, eyeing the $55,000 threshold as the primary liquidity target. Breaching that floor could trigger cascading liquidations across major derivatives exchanges, forcing a comprehensive reset of market sentiment and washing out remaining speculative excess before any genuine macro trend reversal can take place.

Bitcoin Prediction From February Comes Back Into Focus As BT

The Inherent Risks of Relying on Historical Forecasts

While technical roadmaps provide structured frameworks for navigating uncertainty, financial experts continuously issue warnings regarding the dangers of anchoring investment decisions to legacy forecasts. Financial markets are dynamic, highly fluid ecosystems influenced by a constantly shifting matrix of macroeconomic variables, geopolitical events, monetary policy decisions by central banks, and sudden changes in global liquidity.

A forecast that appeared structurally sound in February may completely lose its validity by the time the asset actually reaches the projected price levels, simply because the underlying economic plumbing of the market has transformed. Global interest rates, inflation prints, treasury yields, and regulatory announcements can fundamentally alter institutional appetite for risk assets within a matter of days. Consequently, utilizing an older roadmap as a rigid trading plan is widely regarded by professional risk managers as a hazardous strategy.

Instead, market veterans advocate for a methodology that treats historical roadmaps strictly as observational reference points. By recognizing where historical technical analysis aligns with current order books and price action, traders can better contextualize the severity of ongoing market tests. However, every directional thesis must ultimately pass the test of real-time market confirmation. Relying on an outdated social media post without continuously verifying order flow, volume profiles, and macroeconomic health exposes market participants to unnecessary financial risk.

Broader Market Implications and Macroeconomic Context

The resurgence of interest in Klarck’s Bitcoin roadmap occurs against a broader backdrop of macroeconomic maturation within the digital asset class. As Bitcoin becomes increasingly integrated into traditional financial portfolios, corporate balance sheets, and regulated exchange-traded products, its sensitivity to macroeconomic liquidity cycles has intensified. Gone are the days when retail sentiment alone dictated the cyclical rhythm of the cryptocurrency market. Today, Bitcoin interacts directly with global liquidity indexes, treasury bond yields, and institutional hedging strategies.

This institutionalization means that major price corrections—such as the descent toward the $65,000–$55,000 band—are no longer driven solely by speculative retail fear. They are frequently the result of systematic risk-off positioning by macro funds adjusting their exposure in response to global economic data. When a technical roadmap accurately anticipates the arrival of price at a major historical support zone, it often speaks less to prophetic vision and more to the recurring behavioral patterns of human psychology and algorithmic trading models operating within predictable market structures.

Furthermore, the psychological impact of these zones cannot be overstated. Retail investors watching a popular asset retrace toward lower thresholds often experience heightened anxiety, leading to panic selling at the exact moments when institutional smart money is quietly engaging in accumulation. If the roadmap’s prediction of an eventual transition from accumulation back into macro growth plays out, it will likely be preceded by a period of profound market boredom, sideways consolidation, and widespread despondency among short-term speculators.

Conclusion and Future Outlook

Ultimately, the renewed attention surrounding Klarck’s February Bitcoin roadmap serves as a fascinating case study in market psychology and technical analysis longevity. The fact that Bitcoin has drifted downward into the vicinity of the predicted downside zone has successfully thrust the old projection back into the spotlight, sparking lively debates across digital asset forums and trading desks.

Yet, the overarching lesson for the broader investment community remains one of disciplined caution. While technical roadmaps help map out hypothetical futures and provide conceptual boundaries for risk management, they are not guarantees of future price performance. The $65,000 to $55,000 range stands as an undeniable proving ground for the current market cycle. Whether Bitcoin uses this zone as a launching pad for a renewed structural advance toward the ambitious $140,000 target or succumbs to deeper macroeconomic pressures will depend entirely on real-time market validation, ongoing liquidity dynamics, and incoming macroeconomic data. Until definitive confirmation emerges from current price action, traders and analysts alike would be wise to respect the map without blindly following its every turn.

September 16, 2026 0 comment
0 FacebookTwitterPinterestEmail
Ethereum & Smart Contracts

Ethereum Foundation to Host Annual Protocol AMA on September 16th

by Lina Irawan September 16, 2026
written by Lina Irawan

The Ethereum Foundation has officially announced the next installment of its recurring community-led Ask Me Anything (AMA) session, scheduled to take place on September 16th. This event serves as a pivotal bridge between the core researchers and developers responsible for the Ethereum protocol’s technical trajectory and the vast, decentralized community of stakeholders, validators, and developers who sustain the ecosystem. By utilizing the r/ethereum subreddit—a platform that has hosted these sessions since January 2019—the Foundation continues its commitment to transparency and direct discourse.

This year’s session is particularly significant, as the Ethereum network navigates a complex period of technical maturation. The current landscape is defined by the ongoing testing of the Glamsterdam hard fork, the recalibration of the scope for the Hegotá upgrade, and the long-term conceptualization of the protocol’s roadmap beyond these immediate milestones.

A Legacy of Technical Transparency

Since the inception of these AMA sessions nearly six years ago, the format has remained remarkably consistent. It is structured as a singular, open-ended thread where community members are invited to query the architects of the network on everything from low-level consensus mechanism adjustments to high-level philosophical shifts.

The history of these interactions reflects the broader evolution of Ethereum. In early 2019, the discussions were heavily focused on the transition from Proof-of-Work (PoW) to Proof-of-Stake (PoS). As years progressed, the focus shifted toward the implementation of the Beacon Chain, the subsequent Merge, and the introduction of EIP-4844 (Proto-Danksharding). This chronological progression highlights how the Ethereum Foundation utilizes these sessions not merely for public relations, but as a mechanism for community vetting and collaborative problem-solving.

The Current Technical Horizon

The upcoming session arrives at a critical juncture for Ethereum’s Layer 1 (L1) roadmap. Three major areas of interest are expected to dominate the discussion:

  1. Glamsterdam and Hegotá Upgrades: The Glamsterdam hard fork is currently in its public testing phase. As the industry monitors the stability of these updates, developers are expected to provide insights into potential bugs, performance benchmarks, and the final timeline for mainnet deployment. Simultaneously, the scope of the Hegotá upgrade is currently being narrowed, a process that typically involves balancing the desire for increased network efficiency with the need to minimize technical debt.
  2. Post-Quantum Cryptography: With the rapid advancement of quantum computing, the Ethereum research team has been investigating how to fortify the network against future cryptographic threats. The AMA will likely address the feasibility of implementing quantum-resistant signatures and the impact such shifts might have on existing account abstractions.
  3. L1-zkEVM and Formal Verification: As the ecosystem leans heavily into Zero-Knowledge (ZK) technology, the integration of zkEVMs directly into the Layer 1 protocol remains a hot-button topic. Formal verification—the process of mathematically proving the correctness of code—has become a cornerstone of Ethereum’s security philosophy. Experts are expected to discuss how these verification methods are evolving to meet the demands of a more modular architecture.

Supporting Data and Ecosystem Context

To understand the importance of this dialogue, one must look at the data governing the network’s current state. As of mid-2024, the Ethereum network maintains a robust validator set, with over 1 million active validators staking more than 33 million ETH. This represents a significant portion of the total circulating supply, signaling high confidence in the protocol’s long-term viability despite market volatility.

Furthermore, the surge in Layer 2 (L2) activity has fundamentally changed how the L1 functions. Since the implementation of Proto-Danksharding, data availability costs for L2 rollups have decreased by orders of magnitude. The AMA is expected to touch upon how this shift affects the "future of state"—the challenge of managing the ever-growing size of the Ethereum blockchain and the potential for state expiry or state rent mechanisms to ensure long-term sustainability.

The Evolution of Protocol Governance

The Ethereum Foundation’s decision to hold these sessions in a public forum is a deliberate choice in the context of decentralized governance. While the Ethereum Improvement Proposal (EIP) process dictates the technical path, the social layer of Ethereum—the community, the client teams, and the node operators—must remain aligned for upgrades to succeed.

Industry analysts note that these AMAs serve as a "pressure relief valve" for the ecosystem. By allowing community members to directly address the "Protocol cluster"—the specific team of researchers and developers focused on L1 consensus and execution—the Foundation mitigates the risk of misalignment between core developers and the broader network participants. This direct line of communication is essential for maintaining the "social contract" that governs Ethereum’s development.

Broader Implications and Future Outlook

Beyond the immediate technical updates, the September 16th AMA will likely address the broader philosophical questions facing the protocol. One such topic is "decoupled consensus," a design pattern that seeks to separate the consensus layer from the execution layer more cleanly. This architectural shift could enable greater flexibility in how blocks are built and verified, potentially addressing long-standing concerns regarding centralized block production.

L1 privacy is another area gaining traction. As institutional interest in public blockchains grows, the tension between transparency and user privacy has reached a boiling point. The research community is currently exploring cryptographic primitives that could provide privacy guarantees without compromising the regulatory compliance or auditability that many enterprises require.

Preparing for the Session

The Foundation has proactively opened a submission portal, encouraging community members to submit questions in advance. This structured approach ensures that the most technical and pressing inquiries are prioritized, preventing the session from being overwhelmed by repetitive or low-signal questions.

Historically, the quality of responses provided during these sessions has set a high standard for open-source development. By providing detailed, evidence-based answers, the developers not only educate the community but also create a permanent, searchable repository of technical intent. This documentation is frequently referenced by independent auditors, dApp developers, and educational institutions studying the development of distributed ledger technology.

Conclusion: Why This Matters

The September 16th AMA is more than just a Q&A; it is a manifestation of Ethereum’s commitment to open-source governance. In an industry often characterized by opacity and rapid, centralized decision-making, the Ethereum Foundation’s practice of subjecting its roadmap to the scrutiny of the global community remains a defining feature of the ecosystem.

For stakeholders, developers, and casual observers alike, the upcoming session provides a rare opportunity to peer into the "engine room" of the world’s largest programmable blockchain. Whether the discussion revolves around the nuances of client diversity, the complexities of formal verification, or the long-term vision for L1 privacy, the event will undoubtedly serve as a bellwether for the future of decentralized computing. As the community gathers on r/ethereum, the focus will remain on the fundamental objective: ensuring that Ethereum remains a resilient, scalable, and permissionless protocol capable of supporting the next generation of digital infrastructure.

September 16, 2026 0 comment
0 FacebookTwitterPinterestEmail
Bitcoin & Core Networks

Bitcoin Trades Near $76,000 as Traders Brace for FOMC Policy Decision and Technical Crossroads

by Azzam Bilal Chamdy September 16, 2026
written by Azzam Bilal Chamdy

The global digital asset market finds itself at a critical macroeconomic and technical crossroads as Bitcoin (BTC) hovers tightly around the $76,000 threshold. Investors and institutional market makers are currently holding a cautious stance, awaiting the outcome of the Federal Reserve’s pivotal September policy decision. Following a sharp rejection from higher levels earlier in the month—where prices briefly touched above $82,000—the premier cryptocurrency has experienced a notable 4% pullback. This downward correction has left market participants weighing deteriorating short-term momentum against resilient long-term technical support.

The convergence of monetary policy adjustments, fluctuating institutional exchange-traded fund (ETF) flows, and conflicting chart indicators has created an environment of heightened sensitivity. As the Federal Open Market Committee (FOMC) prepares to release its official rate decision alongside updated economic projections, analysts and traders alike are closely examining the $74,000 to $78,000 range. This narrow trading band is widely expected to dictate Bitcoin’s price trajectory heading into the final quarter of the year.

Bitcoin (BTC) Price Prediction: Will FOMC Volatility Break Bitcoin Out of Its $76K Standoff?

Macroeconomic Background and the FOMC Catalyst

The broader financial landscape has been dominated by anticipatory positioning ahead of the Federal Reserve’s two-day policy meeting, scheduled to conclude with an interest rate announcement at 2:00 p.m. ET, followed by Chair commentary at 2:30 p.m. ET. Financial markets have widely priced in a quarter-point, or 25-basis-point, rate increase, with probability models from major financial institutions reflecting strong consensus around this outcome.

This impending monetary policy action occurs against a backdrop of tightening financial conditions globally. Yields on the benchmark 10-year U.S. Treasury recently pushed past the 5% threshold, creating stiff competition for risk-sensitive assets. Historically, elevated bond yields and a higher-rate environment tend to drain liquidity from speculative markets, casting a shadow over risk-on sectors like cryptocurrency.

Compounding the macro pressure, legislative developments in Washington have also influenced market sentiment. Recent setbacks in the U.S. Senate regarding the advancement of the Clarity Act introduced additional regulatory uncertainty, cooling some of the institutional enthusiasm that had previously fueled Bitcoin’s ascent toward the $80,000 milestone. Consequently, market participants are looking beyond the anticipated 25-basis-point adjustment, focusing heavily on the Fed’s updated economic projections—particularly the "dot plot"—for clues regarding the future path of interest rates and quantitative tightening.

Bitcoin (BTC) Price Prediction: Will FOMC Volatility Break Bitcoin Out of Its $76K Standoff?

Chronology of the Recent Market Correction

To understand Bitcoin’s current positioning, it is necessary to examine the chronology of price movements and institutional shifts that have unfolded throughout September:

  • Early September: Bitcoin demonstrated robust bullish momentum, climbing steadily from mid-August lows and breaking past the psychological $80,000 barrier to peak near $82,000. This rally was heavily supported by consistent capital inflows into U.S. spot Bitcoin ETFs.
  • Mid-September (Legislative and Macro Pressures): Momentum began to stall as legislative momentum for the Clarity Act stalled in the U.S. Senate. Concurrently, rising Treasury yields and macroeconomic anxiety ahead of the September FOMC meeting triggered profit-taking among short-term holders.
  • September 15–16: Bitcoin suffered a sharp 4% single-session decline, slipping below the $76,000 mark. Spot and perpetual market selling intensified, while institutional ETF products flipped from a multi-week buying streak into net outflows.
  • Present Day: BTC trades in a consolidation range between $75,900 and $76,000, caught in a standoff between short-term bearish momentum indicators and foundational long-term moving averages.

Institutional Shifts and ETF Flow Dynamics

One of the primary drivers behind Bitcoin’s recent strength has been the sustained participation of institutional capital through U.S. spot Bitcoin exchange-traded funds, including products managed by BlackRock (IBIT), Fidelity (FBTC), Grayscale (GBTC), and ARK Invest (ARKB). However, recent data compiled by Glassnode indicates a distinct shift in institutional behavior.

Following a robust three-week buying streak—highlighted by a massive $730.9 million net inflow on September 3—the momentum behind ETF accumulation has cooled significantly. As Bitcoin retreated from its $82,000 highs, these institutional vehicles flipped back to recording net outflows. Crucially, the latest dip below $76,000 failed to stimulate renewed ETF demand, removing a vital pillar of support that had previously helped absorb selling pressure during market pullbacks.

Bitcoin (BTC) Price Prediction: Will FOMC Volatility Break Bitcoin Out of Its $76K Standoff?

Market analysts note that while institutional inflows have slowed, the current market structure is characterized more by orderly pressure absorption than a systemic distribution phase. Nevertheless, the absence of aggressive buying from ETF issuers leaves the asset vulnerable to broader macroeconomic shocks stemming from central bank policy announcements.

Technical Analysis: Conflicting Signals on the Charts

From a technical perspective, Bitcoin is presenting a complex array of conflicting signals across different timeframes, leaving traders with a neutral overarching outlook according to aggregate summaries from platforms like TradingView.

On the 4-hour chart, prominent crypto analyst Ali Martinez has highlighted a TD Sequential buy signal, which flashed as Bitcoin hovered near $75,898. The TD Sequential indicator is designed to identify points of trend exhaustion. Historical backtesting of this specific setup on Bitcoin’s chart reveals that past occurrences were followed by relief rebounds ranging between 1.90% and 6.98%. While this technical formation suggests that immediate selling pressure may be running out of steam, analysts caution that fundamental macroeconomic catalysts—such as the FOMC decision—can easily override short-term chart patterns.

Bitcoin (BTC) Price Prediction: Will FOMC Volatility Break Bitcoin Out of Its $76K Standoff?

Momentum indicators provide a more cautious narrative. The 14-period Relative Strength Index (RSI) sits near 47, reflecting a neutral stance that is neither overbought nor oversold. Meanwhile, specific momentum metrics and the Moving Average Convergence Divergence (MACD) continue to flash sell signals, underscoring the recent downside pressure that accompanied the drop from $82,000.

Moving Average Structure and Critical Price Levels

A granular examination of Bitcoin’s moving averages reveals a distinct division between short-term weakness and long-term structural health:

  • Short-Term Resistance: Bitcoin is currently trading beneath several key short-term trend measures, including the 10-day Exponential Moving Average (EMA) near $77,050, the 10-day Simple Moving Average (SMA) around $77,278, and the 20-day EMA near $76,820. The 20-day SMA stands higher at approximately $78,046. A sustained recovery above the $76,800–$78,000 band is required to reestablish short-term bullish control and target Fibonacci resistance near $81,430.
  • Long-Term Support: Conversely, Bitcoin continues to trade comfortably above its longer-term benchmarks, including the 50-day EMA ($73,532), the 200-day EMA ($73,080), and the 100-day EMA ($71,345). This structural cushion explains why aggregate market indicators remain neutral rather than aggressively bearish.
  • Downside Pivot: The classic pivot point rests at approximately $74,081. A decisive break below this critical support level would expose Bitcoin to heightened downside risk, shifting market focus toward the $66,700 to $70,000 support cluster where heavier historical demand is concentrated. Further long-term reference supports are located near $54,842 and $35,603, though these remain distant outliers under current market conditions.

Fact-Based Implications of the Current Standoff

The convergence of these technical and fundamental factors underscores a period of heightened consolidation for the cryptocurrency market. As traders await the Federal Reserve’s official pronouncements, the implications of the current price action extend in two distinct directions.

Bitcoin (BTC) Price Prediction: Will FOMC Volatility Break Bitcoin Out of Its $76K Standoff?

A dovish shift in tone from the Federal Reserve—or guidance interpreted by investors as less restrictive regarding future monetary tightening—could inject fresh liquidity into risk-sensitive markets. Under this scenario, a relief rally would likely encounter immediate resistance around the $78,000 moving average cluster, with subsequent targets pointing back toward the $82,000 resistance ceiling.

Conversely, if the central bank’s economic projections signal a more aggressive or prolonged high-interest-rate environment, the resulting strength in the U.S. dollar and Treasury yields could amplify selling pressure. In this bearish scenario, a break below the $74,000 pivot would validate short-term distribution patterns, opening the door for a deeper correction toward the mid-$60,000 range.

Ultimately, market participants are advised to look beyond the initial price spikes immediately following the FOMC announcement. Analysts emphasize that the post-decision price close and subsequent volume follow-through will provide the most reliable indication of whether Bitcoin can maintain its mid-$70,000 valuation or succumb to broader macroeconomic headwinds. Until then, the digital asset remains locked in a tense $76,000 standoff, awaiting the definitive catalyst that will shape its market direction for the remainder of the quarter.

September 16, 2026 0 comment
0 FacebookTwitterPinterestEmail
Newer Posts
Older Posts

Recent Posts

  • Orderly Network Surpasses $100 Billion In Cumulative Trading Volume
  • Ethereum Network Upgrade Glamsterdam Prepares for Sepolia Activation to Advance Layer 1 Scalability
  • Lido DAO Executes Vote 206: A Deep Dive Into Ethereum Staking Infrastructure Maintenance And Operational Refinements
  • Synthetix Launches Native Multicollateral Margin on Ethereum Mainnet, Enabling Traders to Use Ether as Collateral Without Selling Their Holdings
  • Maxon Integrates Third-Party AI Chatbots Like ChatGPT and Claude into Cinema 4D via Model Context Protocol

Recent Comments

No comments to show.
  • Facebook
  • Twitter

@2021 - All Right Reserved. Designed and Developed by PenciDesign


Back To Top
Crypto Gohan
  • Home

We are using cookies to give you the best experience on our website.

You can find out more about which cookies we are using or switch them off in .

Crypto Gohan
Powered by  GDPR Cookie Compliance
Privacy Overview

This website uses cookies so that we can provide you with the best user experience possible. Cookie information is stored in your browser and performs functions such as recognising you when you return to our website and helping our team to understand which sections of the website you find most interesting and useful.

Strictly Necessary Cookies

Strictly Necessary Cookie should be enabled at all times so that we can save your preferences for cookie settings.