Ethereum, the second-largest cryptocurrency by market capitalization, continues to grapple with persistent selling pressure, holding firmly below the critical $1,700 threshold. This protracted period of price stagnation has bred a palpable sense of apathy and uncertainty across the market, frustrating participants on both bullish and bearish sides as the asset struggles to find a decisive direction. While the price action has shown neither a convincing recovery nor an aggressive breakdown, a deeper dive into network activity data by CryptoOnchain has unveiled a significant divergence that challenges the superficial narrative of a market in structural decline. This granular analysis suggests a complex interplay of forces, where a retreat by smaller, routine investors is being offset by strategic positioning from larger, more sophisticated market participants.
The Current Market Climate: Apathy and Uncertainty
The cryptocurrency market, and Ethereum specifically, has been navigating a challenging landscape marked by macroeconomic headwinds and a broader risk-off sentiment. Factors such as persistent inflation concerns, rising interest rates from central banks globally, and increased regulatory scrutiny have contributed to a cautious environment. For Ethereum, this has meant an inability to sustain upward momentum, leaving its price oscillating in a tight range below key psychological and technical levels. The current struggle below $1,700 is indicative of this broader market malaise, where conviction is low, and investors are hesitant to commit significant capital without clearer catalysts.
The period spanning recent months has seen Ethereum’s price consolidate, followed by a notable breakdown. This lack of clear direction has often led to participant fatigue, where smaller, less capitalized investors tend to withdraw, waiting for more definitive market signals. This pattern is not uncommon in bearish or sideways markets, where the immediate incentive for active trading diminishes, and the focus shifts towards capital preservation.
Divergent On-Chain Signals: Retail Retreat, Whale Accumulation
A crucial development identified by CryptoOnchain, leveraging data from CryptoQuant, points to a striking divergence in Ethereum’s on-chain transaction patterns over the past week. A superficial glance might suggest trouble: daily transactions originating from regular user wallets have plummeted by approximately 43%. In isolation, such a decline could be interpreted as a network losing engagement and relevance, signaling a flight of retail interest during a difficult market phase. However, this initial reading merely scratches the surface of a more nuanced reality.
Counterbalancing this sharp decline in transaction count, the average value moved per transaction has surged by over 184%. Even more strikingly, the median transfer size has witnessed an even sharper increase. This data paints a picture where Ethereum is indeed processing fewer transactions overall, but the transactions it is handling are dramatically larger in value than those observed previously.

This specific combination of declining transaction counts and surging transfer values is a historically recognizable pattern for seasoned observers of on-chain behavior, particularly during periods of market stress. It typically signifies a shift in market participation: smaller, routine participants, often characterized by their higher frequency but lower-value transactions, tend to step aside. They reduce their activity, opting to wait for greater market clarity or a shift in sentiment. Conversely, larger holders, often referred to as "whales" or institutional entities, continue their operations. Their activity is characterized by fewer but more significant capital movements, reflecting deliberate, strategic positioning rather than routine network usage or speculative trading.
CryptoOnchain’s analysis firmly argues that this divergence is not the signature of a fading network or a loss of fundamental utility for Ethereum. Instead, it is interpreted as a clear indication of capital consolidating into fewer, more significant hands at current price levels. This phenomenon suggests that while the broader market sentiment may be bearish, underlying accumulation by larger entities is actively taking place.
Historical Parallels and Behavioral Patterns
The observed on-chain behavior in Ethereum echoes patterns seen in previous market cycles, particularly during periods of price consolidation or downturns. Historically, such phases have often served as redistribution events, where assets flow from "weak hands" (retail investors prone to panic selling or capitulation) to "strong hands" (experienced investors or institutions with a longer-term outlook and deeper pockets). These larger entities leverage lower prices to accumulate assets, often at discounted rates, preparing for eventual market recoveries.
During these accumulation phases, retail engagement often wanes due to a combination of factors: market fatigue, losses incurred during downturns, and a general lack of exciting price action. This reduced activity by smaller participants creates less "noise" on the blockchain, allowing the strategic movements of larger players to become more apparent in the data. The current scenario with Ethereum’s transaction metrics aligns closely with these historical precedents, suggesting that despite the bearish sentiment, a foundational shift in ownership is underway.
The Supply Squeeze: ETH Leaving Exchanges
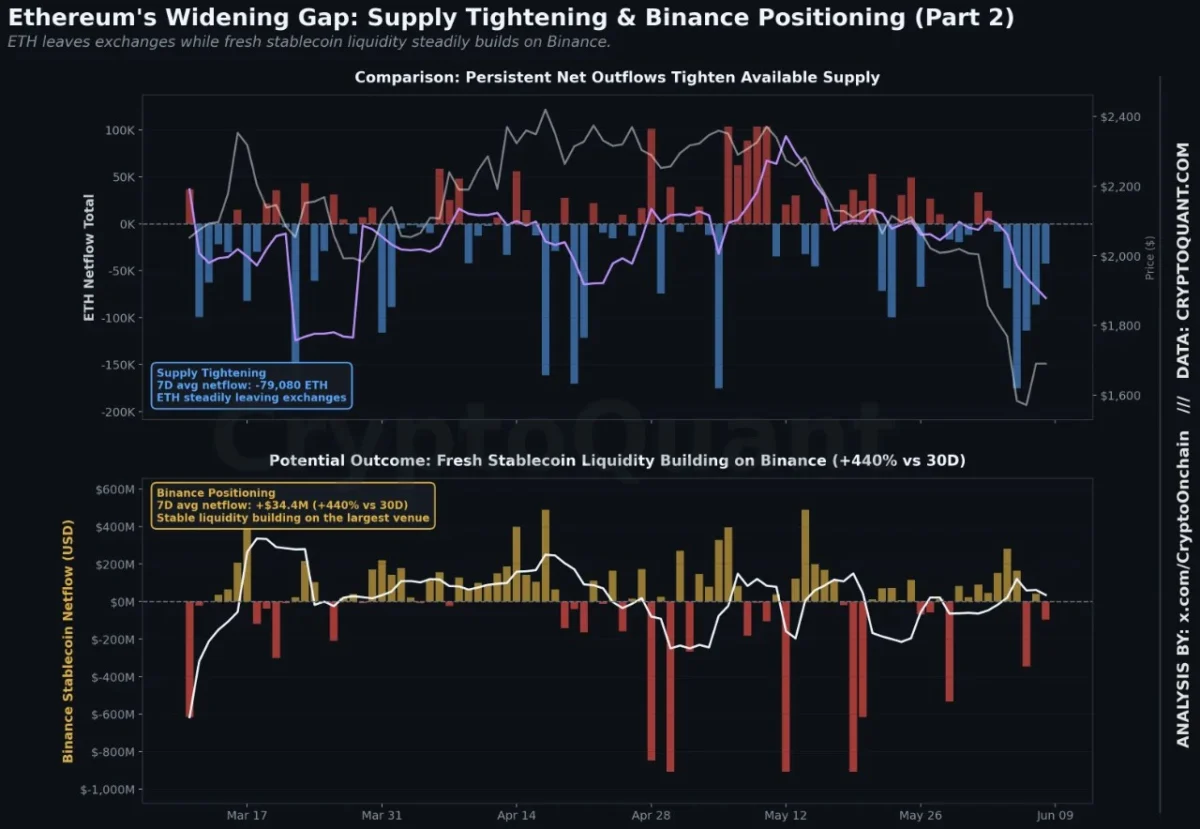
Further reinforcing the narrative of strategic accumulation and a tightening market structure, broader flow data confirms this behavioral pattern from multiple independent angles. Total ETH netflows remain deeply negative, indicating approximately -79,080 ETH leaving exchanges consistently rather than accumulating on platforms where they would be readily available for immediate sale.
Negative netflows signify that more Ethereum is being withdrawn from centralized exchanges than is being deposited. This behavior is typically associated with investors moving their assets to cold storage, staking protocols, or decentralized finance (DeFi) applications. These actions often signal an intention to hold the asset for the long term, reducing the immediate sell-side pressure on exchanges. This ongoing contraction of spot supply is a critical component of the "tightening float" dynamic, suggesting that the readily available supply of ETH for sale is diminishing.

Accumulating Buying Power: Stablecoin Inflows and Derivatives Positioning
Simultaneously, evidence suggests that fresh capital is strategically positioning itself within the market, particularly on major exchanges like Binance, via stablecoin channels. Stablecoin netflows into Binance have turned strongly positive, registering a significant influx of +$34.4 million. This represents an astonishing 440% increase compared to the 30-day average.
The inflow of stablecoins into exchanges is a strong indicator of potential buying power. Stablecoins, being pegged to fiat currencies, serve as a primary on-ramp for new capital entering the crypto market or for existing capital being prepared to purchase volatile assets like Ethereum. A substantial increase in stablecoin inflows suggests that a significant amount of capital is being mobilized and positioned to acquire assets.
Complementing this, Open Interest (OI) on Binance has expanded by approximately 9% over the quarter. Open Interest refers to the total number of outstanding derivative contracts (futures or options) that have not yet been settled. An increase in OI, particularly alongside stablecoin inflows, confirms that larger participants are not only accumulating spot ETH but are also quietly building derivatives exposure. This could be for hedging existing positions, speculating on future price movements, or employing more complex trading strategies, all of which point to a heightened level of engagement and strategic positioning by sophisticated traders.
Market Structure: A Tightening Float Meets Concentrated Demand
The combination of these on-chain metrics — declining retail transaction counts, surging average transaction values, negative ETH netflows from exchanges, significant stablecoin inflows, and expanding Open Interest — paints a cohesive picture. This analysis identifies a specific and historically recognizable market structure. Retail participation is thinning out, leading to reduced speculative noise, while larger entities are simultaneously withdrawing spot ETH from exchanges and parking substantial stablecoin liquidity on major trading platforms.
This scenario describes a market where the available float (the supply of an asset readily available for purchase on exchanges) is tightening significantly from the supply side. Concurrently, potential demand is accumulating on the buy side, largely concentrated in the hands of larger, well-capitalized players.
It is crucial to frame this analysis with honesty and objectivity. While this combination of factors creates a compelling structural setup, it does not inherently guarantee an immediate price reversal. Structural setups, by their nature, require a catalyst to activate them and trigger a more pronounced market move. However, what this confluence of data does describe is a specific pre-condition that has historically preceded more substantial market rallies. It outlines an environment where the participants who remained active and accumulated during the apathy phase are strategically positioned to benefit disproportionately when market sentiment eventually shifts, and renewed demand enters the ecosystem.

Ethereum’s Technical Landscape: A Battle for Support
From a technical analysis perspective, Ethereum’s daily timeframe remains firmly under bearish control. The price is currently trading near $1,630, having suffered a sharp breakdown from a multi-month consolidation pattern that characterized trading between February and May.
The most significant technical development on the chart has been the decisive loss of the $1,800–$1,900 support zone. This area had repeatedly acted as a robust demand zone throughout the first half of the year, absorbing selling pressure and providing a floor for price. Once this critical floor failed, selling pressure intensified rapidly, pushing ETH to fresh recent lows near $1,500.
From a market structure perspective, the sequence of highs and lows clearly indicates a downtrend. The recovery attempt between April and May peaked near $2,400, creating a lower high relative to previous rallies earlier in the year. Since then, Ethereum has consistently produced a series of lower highs and lower lows, culminating in the recent collapse through the established support. Crucially, the current price is trading well below its 50-day, 100-day, and 200-day moving averages. This alignment of key moving averages, with price below all of them, broadly confirms widespread weakness across all major timeframes, signaling a strong bearish trend.
Volume behavior adds another layer of insight. The recent selloff that broke the $1,800–$1,900 support zone generated one of the largest volume spikes seen in months. This surge in trading volume during the breakdown signals aggressive participation from sellers, indicating conviction behind the move. While a short-term bounce has emerged from the $1,500 area, buyers have so far failed to reclaim any meaningful resistance levels, suggesting that the bounce may be corrective rather than indicative of a sustained reversal.
The immediate battleground for Ethereum is the $1,500–$1,550 region, which now represents the most important psychological and technical support level for the year. A sustained hold above this zone could potentially allow Ethereum to establish a base after enduring a nearly 35% decline from its May highs. However, unless the price can convincingly reclaim the former support zone around $1,800, any rallies are likely to be viewed by technical analysts as mere corrective moves within a broader downtrend, rather than the beginning of a durable and robust recovery.
Broader Implications and Future Outlook
The confluence of these on-chain insights and technical indicators presents a nuanced, yet potentially bullish, long-term outlook for Ethereum, despite its current price struggles. While short-term price action remains undeniably bearish, the underlying structural shifts identified by CryptoOnchain suggest a significant accumulation phase by well-capitalized entities. This divergence between declining retail engagement and increasing institutional-grade activity implies a transfer of supply into stronger hands.

The "tightening float" scenario, where available supply on exchanges diminishes due to withdrawals and accumulation, combined with accumulating stablecoin reserves for potential future purchases, creates a coiled spring effect. When external catalysts emerge—such as favorable macroeconomic shifts, regulatory clarity, a significant network upgrade (e.g., continued progress on scaling solutions or new features), or a general resurgence in market sentiment—this structural setup could lead to a more explosive upward price movement. The participants who positioned themselves during this period of apathy would then stand to benefit disproportionately.
However, the immediate challenge for Ethereum remains its ability to regain critical technical levels. The $1,800 resistance zone is paramount for any sustained recovery. Until that level is reclaimed, the market is likely to remain skeptical of rallies, viewing them as temporary corrections. The coming weeks will be crucial in determining whether the $1,500–$1,550 support can hold, allowing for the formation of a base from which Ethereum might eventually mount a more significant recovery. The current period, therefore, represents a critical juncture where underlying market structure is being reshaped, even as superficial price action continues to signal weakness.