
The cryptocurrency landscape is currently witnessing one of the most intriguing structural paradoxes in the history of digital assets: a stark divergence between Ethereum’s foundational network health and its immediate price trajectory. As persistent bearish sentiment dominates the broader market, dragging Ethereum (ETH) down to test crucial support lines around the $1,600 threshold, on-chain metrics reveal a completely different narrative. Rather than collapsing, Ethereum’s fundamental ecosystem activity is surging to historic all-time highs. Users, developers, and institutional entities are interacting with the blockchain at unprecedented rates, while massive volumes of coins are being systematically drained from centralized exchanges.
This juxtaposition has left traders, market analysts, and long-term investors weighing the likelihood of a deeper correction—with some technical models pointing toward historic support zones—against the undeniable strength of institutional accumulation and network utility. To understand where Ethereum is heading, one must dissect the layers of this complex market phenomenon, examining the historical milestones, on-chain analytics, exchange dynamics, and macro-financial implications driving the second-largest cryptocurrency by market capitalization.
The Divergence: Bearish Price Action Meets Bullish On-Chain Fundamentals
Financial markets are rarely monolithic, but the current state of Ethereum highlights a uniquely sharp contrast between short-term price discovery and long-term fundamental adoption. While the asset’s valuation has experienced heavy downward pressure, threatening a descent toward the $1,500 psychological and technical support zone, the underlying plumbing of the network tells a story of aggressive, organic growth.
In traditional finance, a falling asset price accompanied by rising fundamental usage often signals a deep value territory or a temporary market disconnect. For Ethereum, this disconnect is manifested through surging daily active addresses, record-low exchange reserves, and robust transaction volumes. Despite the unfavorable macro environment and negative price momentum, the network continues to act as the world’s leading settlement layer for decentralized finance (DeFi), real-world asset (RWA) tokenization, smart contract execution, and layer-2 scaling ecosystems.
Historical Context and Network Growth Milestones
To fully appreciate the gravity of Ethereum’s current on-chain metrics, it is necessary to examine how network usage has evolved across previous market cycles. Network activity, measured primarily by daily active wallet addresses, has historically served as a lagging indicator of macro sentiment but a leading indicator of long-term adoption.

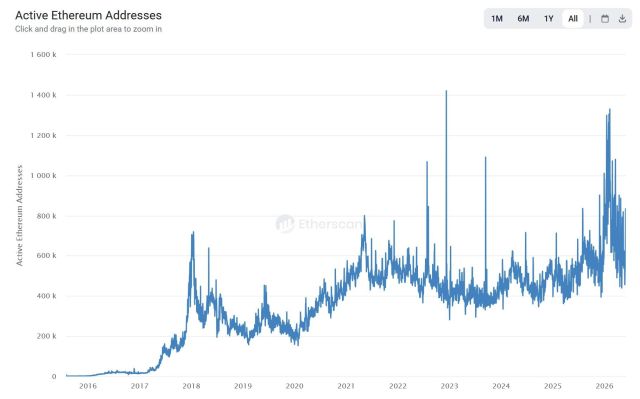
During the 2018 bear market—a period commonly referred to as the "crypto winter"—Ethereum’s daily active addresses peaked at approximately 720,000. Fast forward to the hyper-speculative bull market cycle of 2021, driven by the explosive growth of decentralized finance and non-fungible tokens (NFTs), and that peak climbed to roughly 800,000 daily active addresses.
However, data shared by Leon Waidmann, Head of Research at Lisk, indicates that the current market cycle has shattered those historical ceilings. Throughout the 2025–2026 period, Ethereum’s daily active addresses have consistently pushed past the 1 million mark, with periodic spikes peaking above 1.3 million. This substantial increase demonstrates that the network is currently processing significantly more organic, daily user activity than it did at the absolute height of the 2021 bull market mania.
This exponential growth can be attributed to several structural upgrades over the years, including the maturation of layer-2 scaling rollups like Arbitrum, Optimism, Base, and zkSync. These networks have drastically reduced transaction fees, inviting retail participants and high-frequency institutional applications back to the Ethereum ecosystem without congesting the main base layer.
Liquidity Dynamics: The Great Exchange Drain
Compounding the significance of this high network activity is an unprecedented trend in exchange supply dynamics. In typical market downturns, heightened volatility and bearish panic trigger massive inflows of digital assets onto centralized exchanges as investors rush to liquidate holdings, hedge positions, or cut losses.
Yet, the current cycle has produced the exact inverse reaction. According to on-chain data tracked by analysts, the total balance of Ethereum held on centralized cryptocurrency exchanges dropped to approximately 14.5 million ETH. This represents the lowest exchange reserve level in the history of the asset—a milestone typically witnessed only during capitulation events rather than sustained bear markets.
For context, in October 2023, exchange balances sat at roughly 21 million ETH. Over the subsequent two and a half years, more than 6 million ETH have been steadily withdrawn from trading platforms into cold storage, staking contracts, and private custody solutions.

Commenting on this unprecedented liquidity squeeze, market expert Leon Waidmann succinctly noted, "Whoever is buying here isn’t selling back." This massive exodus of coins from liquid trading venues creates a structural supply deficit. When a large volume of an asset is locked away or held by long-term conviction buyers, even a modest increase in buy-side demand can trigger rapid upward price volatility. The reduction of circulating supply on exchanges effectively mitigates immediate sell pressure, creating a resilient floor supported by strong hands.
Price Bottom Analysis and Technical Projections
Despite robust on-chain health, technical analysts continue to scrutinize price charts to identify where the current bearish cycle might officially bottom out. A prominent analysis by crypto analyst Ali Charts has introduced a compelling framework utilizing the Ethereum Delta Price metric to pinpoint historic market cycle floors.
The Delta Price metric is a sophisticated on-chain indicator calculated by measuring the difference between the average price at which all coins were last moved on-chain (investor cost basis) and the theoretical cost of production (miner production cost). Historically, this metric has served as a reliable compass for identifying deep macro accumulation zones where selling exhaustion occurs, successfully flagging the ultimate bottoms of previous market cycles.
By applying this model to current market structures, Ali Charts’ analysis indicates that Ethereum’s ultimate cycle price bottom could theoretically reside near the $700 region. While a drop to $700 would represent a severe correction from current trading levels around $1,657, technical analysts emphasize that historical market behaviors often involve sharp, liquidity-seeking wicks before a sustainable, multi-year upward trend begins.
However, market participants remain divided. While quantitative models like the Delta Price metric account for miner economics and long-term cost bases, they operate in a financial landscape vastly different from previous eras. The presence of spot Ethereum Exchange-Traded Funds (ETFs), deeper institutional balance sheet integration, and massive corporate treasury allocations provide modern price floors that did not exist during prior cyclical downturns.
Broader Economic Implications and Industry Reactions
The divergence between Ethereum’s price depression and its surging adoption underscores a broader maturation within the digital asset class. Institutional participants—ranging from corporate treasuries managed by figures like Tom Lee’s Bitmine to major asset management firms offering spot ETH products—are increasingly decoupling their long-term thesis from short-term retail sentiment.
Industry observers note that institutional investors are capitalizing on the depressed price action to accumulate Ethereum at a discount, viewing short-term volatility as noise against the backdrop of long-term utility. As Ethereum cements its role as the primary settlement layer for global tokenized assets, institutional-grade stablecoins, and decentralized applications, its fundamental value proposition remains intact regardless of cyclical price drawdowns.
Financial analysts point out that the ongoing accumulation phase mirrors historical accumulation patterns seen in legacy equities during prolonged macroeconomic tightening cycles. When macroeconomic conditions eventually shift toward monetary easing, assets with high structural demand, low exchange liquidity, and expanding network utility are historically positioned to experience aggressive upward repricing.
Conclusion and Outlook
Ethereum stands at a historic crossroads. On one side, relentless bearish pressure threatens to test pivotal structural supports, with technical indicators hinting at the possibility of deeper corrections toward historical valuation bands. On the other side, the network is operating at peak efficiency, processing record daily active addresses, supporting burgeoning layer-2 ecosystems, and witnessing an unprecedented supply drain from centralized exchanges.
As more than 6 million ETH vanish from trading platforms and daily user engagement shatters past cycle records, the fundamental thesis supporting Ethereum has rarely been stronger. Whether the market undergoes a final flush toward historical metric bottoms or builds an immediate base from current levels, the structural gap between network utility and price valuation remains one of the most closely watched phenomena in modern financial history.