
Solana (SOL) is trading near the $103.47 threshold, stabilizing after a modest 0.18% intraday contraction over a 24-hour window, according to market data metrics. The digital asset has caught the attention of traders, institutional analysts, and macro-observers alike as it attempts to solidify a bottom following a prolonged and punishing 10-month bearish cycle. While short-term consolidation persists above immediate psychological barriers, a confluence of improving higher-timeframe technical indicators, strengthening momentum oscillators, and substantial fundamental adoption in the real-world asset (RWA) tokenization sector has begun reshaping market sentiment.
Market participants are closely monitoring whether the current price action can overcome stubborn overhead resistance at the $120 mark, a pivotal level that analysts suggest could unlock a broader recovery pathway toward $146.56 and beyond. Simultaneously, robust metrics highlighting Solana’s expanding utility in enterprise-grade financial settlements underscore a maturing network whose fundamental backing continues to evolve alongside its spot market price dynamics.
Chronology of a Rebound: From $60 Lows to a Monthly Technical Reversal

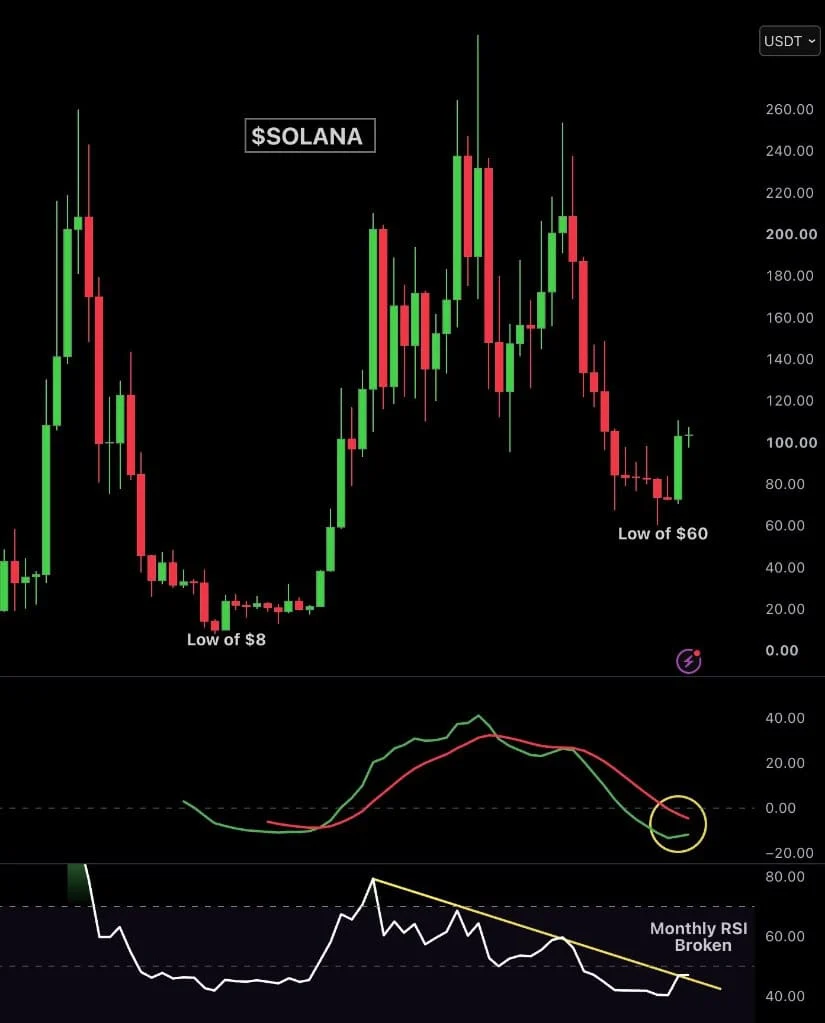
The path toward Solana’s current valuation near $103 has been forged through a series of decisive technical steps following an extended period of depressive price action. After bottoming out near the $60 region earlier in the market cycle, SOL staged an aggressive recovery that culminated in a milestone technical event: the printing of the asset’s first green monthly candlestick in ten months.
For a digital asset that suffered persistent, unremitting selling pressure throughout much of the previous year, the shift in monthly momentum marks a psychological and structural turning point. Market analysts, including prominent cryptocurrency commentator Ash Crypto, have pointed out that the monthly Moving Average Convergence Divergence (MACD) indicator is rapidly approaching a bullish crossover. Simultaneously, the monthly Relative Strength Index (RSI) has successfully breached a descending trendline that had capably suppressed upward momentum for roughly two years.
These developments do not instantly confirm a definitive, macro-level trend reversal, but they signify a quantifiable weakening of the long-term bearish structure. Having successfully pushed past the key daily resistance barrier at $97.70, SOL has established a vital short-term accumulation base. Market bulls are now tasked with defending this zone as a newly minted support floor while turning their sights toward higher horizontal hurdles.
Decoding the Technical Setup: Critical Support and Resistance Zones

As Solana trades tightly within the $103 to $105 range, market technicians have clearly defined the parameters governing the asset’s immediate future. The decisive break above the $97.70 resistance level has transformed it into the primary line of defense for the ongoing bullish thesis. As long as spot prices maintain acceptance above this threshold, the near-term breakout structure remains intact.
To the upside, analytical setups mapped out by market observers such as Ucan Coin isolate $120.23 as the next major resistance barrier. A confirmed, sustained daily close above this level would signal the formation of a higher high on the chart, opening a clear pathway toward an extended recovery phase targeting the $130 to $140 range, with the larger macro resistance zone sitting firmly at $146.56.
Conversely, failure to maintain momentum above the $97.70 pivot point would expose Solana to downside vulnerability. A breakdown beneath this support level would likely invite fresh selling pressure, potentially steering the token toward a retest of the $81.35 lower support shelf. This strict demarcation between continuation and retracement places immense importance on how buyers and sellers interact at current levels over upcoming trading sessions.
Macro-Level Speculation: Long-Term Patterns and Ambitious Projections

Beyond immediate daily and weekly chart structures, higher-timeframe technical perspectives have introduced longer-term possibilities for the network’s native token. Prominent market analysts have identified a massive bullish flag formation developing on macro charts following the sharp expansion phase observed from the 2023 cyclical lows.
Rather than experiencing a complete structural collapse, Solana spent an extended duration consolidating within a downward-sloping channel—a market behavior frequently interpreted as a continuation pattern rather than a trend inversion. Commentary from analysts like CryptoCurb suggests that if a breakout materializes along the upper boundary of this multi-year flag, the measured move could eventually project toward highly ambitious long-term targets exceeding $1,000.
However, mainstream financial analysts and veteran traders caution that such long-term projections remain highly speculative. For a four-figure valuation to enter the realm of technical plausibility, SOL would need to successfully clear its current immediate hurdles, reclaim previous cycle highs in the $200 to $300 range, and establish an unprecedented macro-level expansion phase supported by sustained institutional liquidity and systemic adoption.
Fundamental Tailwinds: Solana’s Dominance in Tokenized Real-World Assets

While chart patterns and momentum indicators dictate short-term trading sentiment, Solana’s fundamental growth narrative continues to provide a robust backing for the network’s long-term valuation proposition. Over the past year, the Solana blockchain has emerged as a powerhouse in the nascent tokenized real-world asset (RWA) market, cementing its reputation for high-speed, low-cost transaction finality.
Recent network data indicates that Solana handled approximately $14.7 billion in tokenized asset trading volume over a twelve-month span, capturing roughly 32% of the broader reported RWA spot market volume within an ecosystem valued at approximately $46 billion overall. This expansive utility is further evidenced by institutional-grade metrics: platform offerings like Backpack recorded roughly $1.5 billion in equity trading volume within a compressed two-month window, while collaborative initiatives involving financial giants such as BlackRock and Securitize accounted for approximately $993 million in institutional fixed-income issuances directly on the network.
Although on-chain fundamental growth metrics do not instantaneously dictate spot market pricing, sustained adoption of this magnitude builds a resilient structural foundation. As traditional finance increasingly merges with decentralized ledger technology, networks capable of absorbing multi-billion-dollar throughput without performance degradation stand to benefit disproportionately from systemic capital inflows.
Implications and Outlook for Market Participants

The convergence of shifting technical momentum and expanding real-world utility places Solana at a critical juncture. The completion of a rare green monthly candle, coupled with an impending MACD crossover and a definitive RSI trendline breakout, suggests that the worst of the multi-month bearish correction may be fading into the background.
Nevertheless, traders remain acutely aware of the technical hurdles ahead. The immediate battleground rests squarely between the $97.70 support floor and the $120.23 resistance ceiling. A decisive breakout above $120 would validate the more optimistic market projections, bringing the $146.56 target into sharp focus and reinforcing the narrative of a durable macroeconomic trend reversal. Until then, Solana’s ability to defend the $100 psychological pivot will dictate whether the current recovery solidifies into a sustained bull market continuation or retreats into another phase of range-bound consolidation.
