
The cryptocurrency market has once again found itself gripped by severe volatility and widespread panic, following a sharp correction that drove Bitcoin down to the $59,000 threshold. For many retail traders and short-term speculators, this sudden downturn has ignited memories of previous prolonged crypto winters, triggering extreme fear indices across digital asset exchanges. However, not all market participants view the pullback with alarm. A segment of seasoned analysts and long-term investors contend that the recent price action is not an anomaly, but rather a textbook manifestation of a macro cycle unfolding precisely as projected by historical market models.
Among those unfazed by the recent turbulence is prominent crypto analyst Alex Mason. Rather than signaling an unexpected breakdown of the asset’s structural integrity, Mason interprets the slide to $59,000 as a calculated, natural trajectory that brings Bitcoin one step closer to establishing its definitive bear market bottom. By evaluating the confluence of macro timelines, technical indicators, and historical cycle patterns, Mason has outlined a roadmap for Bitcoin’s trajectory—one that envisions temporary relief rallies, subsequent deep corrections, and ultimately, an ambitious multi-year ascent into six-figure territory.
Understanding the Bear Market Context
To comprehend the significance of the $59,000 level, it is essential to contextualize the broader macroeconomic and cyclical environment governing Bitcoin. The digital asset ecosystem has labored under persistent bearish pressure for well over a year. Extended market corrections of this nature typically shake out leveraged positions, test the conviction of retail participants, and lay the psychological groundwork for the accumulation phase that precedes a new secular bull market.

Historically, Bitcoin’s market cycles are defined by four-year intervals largely dictated by its halving schedule, interspersed with aggressive rallies and punishing retracements. During these corrective phases, price discovery moves downward in structured waves, systematically trapping liquidity and testing critical historical support levels. Mason’s analysis suggests that the persistent downward trend observed over the past twelve months is rapidly approaching its climax. According to his market framework, the recent plunge to $59,000 followed by a modest recovery toward $61,000 serves as a technical confirmation that the asset has officially transitioned into the terminal phase of the current bear market cycle.
Chronology of the Projected Price Action
Rather than anticipating a miraculous, uninterrupted V-shaped recovery, Mason’s cyclical roadmap maps out a complex sequence of technical movements designed to flush out remaining weak hands before any sustainable bullish reversal can take place.
The immediate aftermath of the $59,000 crash saw a temporary relief rally pushing prices back toward the $65,000 region. However, Mason warns that this anticipated recovery should not be misconstrued as the definitive bullish confirmation that market participants are eagerly waiting for. Instead, this intermediate bounce is viewed merely as a transitional phase that will ultimately set the stage for a much more severe leg down.
According to this forward-looking projection, the failure to sustain momentum above the $65,000 resistance zone is expected to trigger a significant downward impulse. This secondary wave of selling pressure is forecasted to breach initial support at the $57,000 level. As liquidation cascades through the order books, the decline is projected to deepen further, dragging Bitcoin down into the upper $40,000 range. Mason pinpoints the ultimate bear market bottom in the vicinity of $47,000—a level that is anticipated to absorb remaining selling pressure and establish the ultimate launchpad for the subsequent macro cycle.

The Path to Six-Figure Valuations and Beyond
While a drop into the $40,000s would undoubtedly renew panic across mainstream media outlets and social media channels, Mason’s long-term outlook remains profoundly bullish. The structural thesis posits that once Bitcoin successfully secures a definitive macro low around the $47,000 support floor, the foundation for the next structural expansion will be firmly cemented.
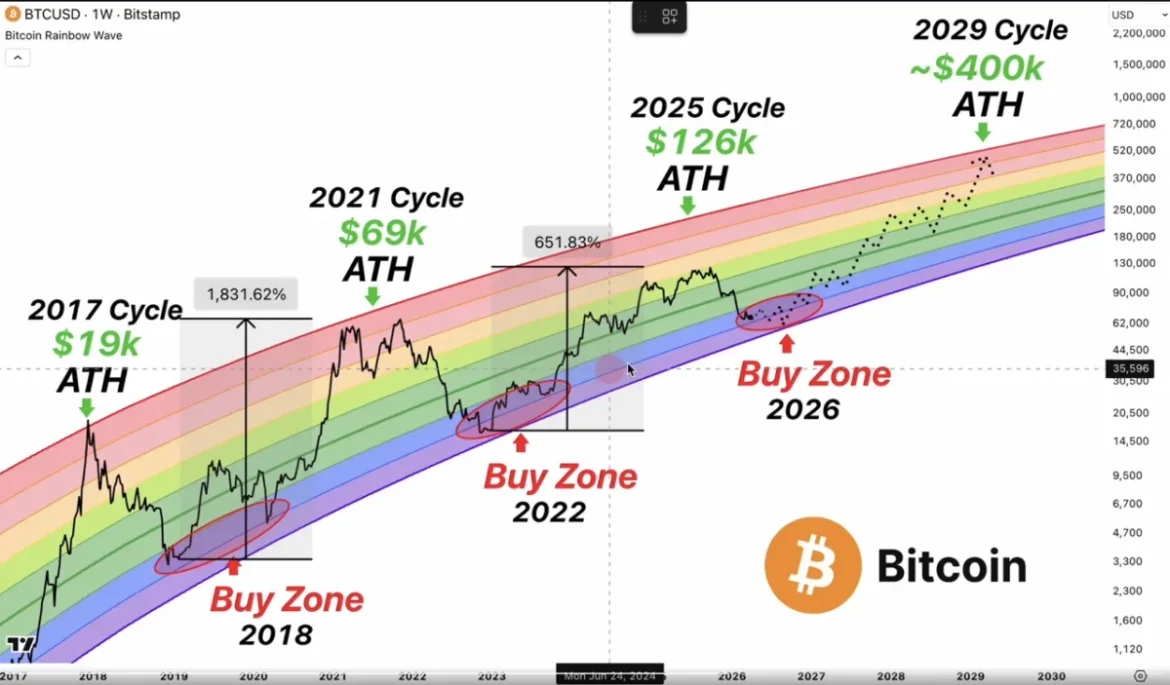
The transition from this anticipated cyclical bottom into sustained bullish territory is projected to ignite a powerful macro markup phase. By drawing upon long-term valuation frameworks such as the Bitcoin Rainbow Chart—a logarithmic regression tool historically used to map out long-term price bands and sentiment cycles—Mason’s analysis suggests that Bitcoin will not only recover its previous all-time highs but surpass them exponentially.
Under this long-term projections model, the upcoming bull run is expected to carry the world’s largest cryptocurrency well into six-figure territory. Specifically, the analyst projects that the peak of the current cycle will push Bitcoin toward the $200,000 milestone, representing a staggering valuation increase of more than 200% from current trading levels. Looking even further ahead into the decade, extended cyclical modeling places the ultimate peak of the broader macro cycle as high as $400,000 by the year 2029, assuming historical adoption curves, institutional inflows, and macroeconomic monetary policies continue to favor scarce digital assets.
Broader Implications and Market Sentiment
The dichotomy between prevailing market fear and analytical calm highlights a fundamental reality of cryptocurrency investing: short-term volatility often obscures long-term structural trends. While derivatives markets frequently experience extreme liquidations during sudden downturns, veteran market observers emphasize the importance of maintaining a macro perspective.
The current market phase serves as a crucible for institutional and retail investors alike. As regulatory landscapes evolve, exchange liquidity shifts, and macroeconomic factors such as interest rate trajectories and inflation metrics fluctuate, Bitcoin continues to trade at the intersection of traditional finance and emerging technological adoption. Whether Mason’s precise price milestones—ranging from the anticipated drop to $47,000 to the eventual surge toward $200,000—will materialize precisely as charted remains a subject of intense debate among technical analysts and quantitative researchers.
Nevertheless, the framework underscores a vital principle for market participants navigating digital asset cycles: extreme fear frequently accompanies historical accumulation windows. As Bitcoin continues to test crucial technical boundaries in its ongoing search for a definitive cyclical bottom, the coming months will likely determine whether the market is truly entering the final chapter of its current correction or if further macroeconomic headwinds lie ahead.
