

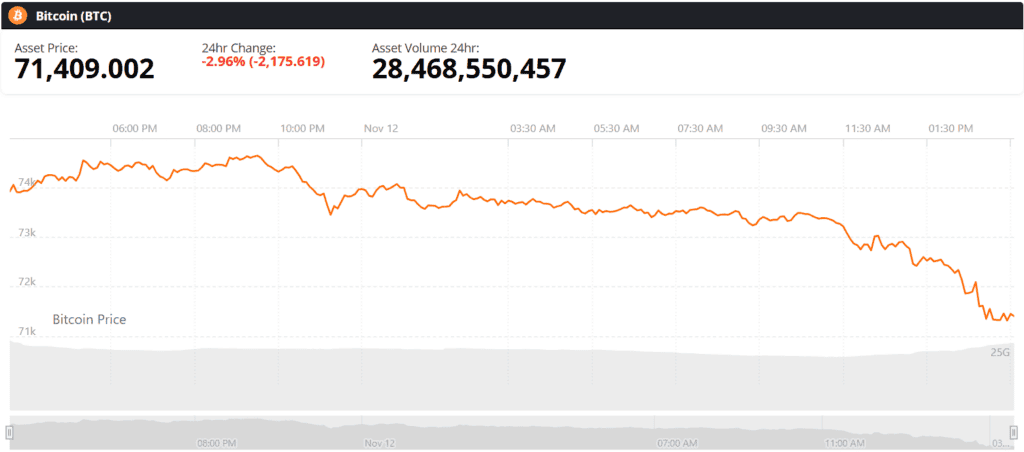
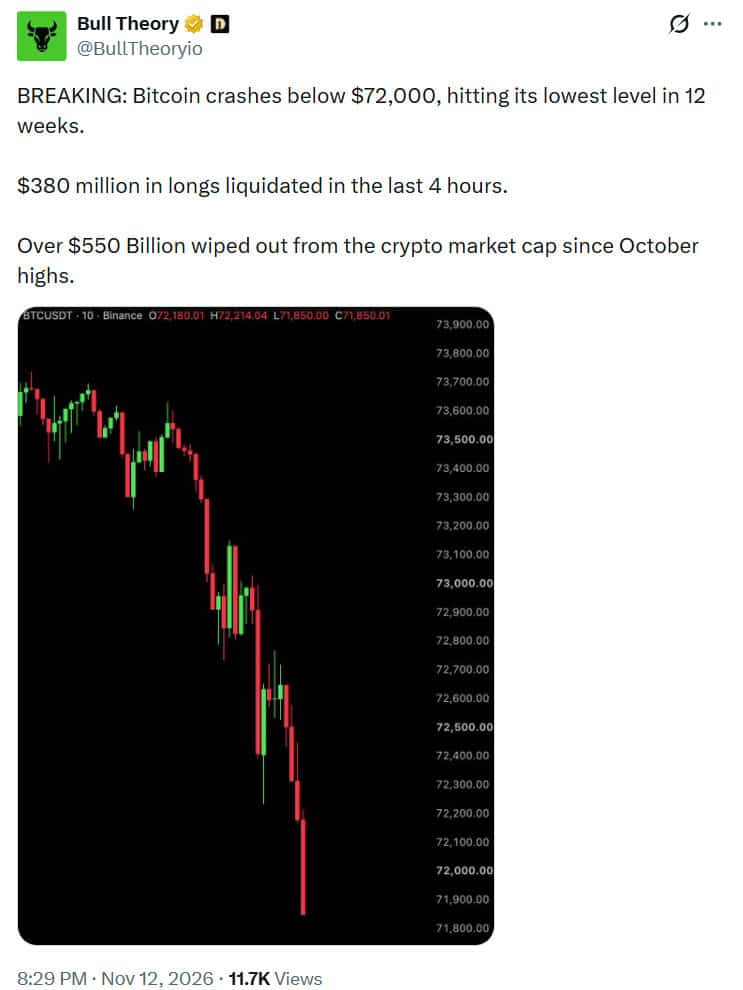
The broader cryptocurrency landscape faced an aggressive downturn mid-November, culminating on Thursday, November 12, when Bitcoin briefly slipped below the critical $72,000 threshold. The digital asset market has suffered severe structural damage since reaching its yearly peak in October, with market aggregators estimating that over $550 billion in cumulative market capitalization has been systematically erased. The latest price drop reflects a confluence of compounding macroeconomic headwinds, shifting institutional sentiment, and a massive wave of forced liquidations across major derivatives exchanges that caught leveraged bullish traders off guard.
As trading desks adjusted to shifting macroeconomic conditions, Bitcoin retreated from an intraday high near $74,695 down to approximately $71,548. This sudden depreciation represents a nearly 2.8% loss over a 24-hour window, compounding into a weekly contraction of roughly 9%. While the primary cryptocurrency staged a modest recovery back into the mid-$73,000 range shortly after touching multi-month lows reminiscent of August pricing, investor confidence remains deeply fractured. The inability of bulls to reclaim key moving averages has amplified fears that the current corrective phase could extend further down toward psychological support zones.
A Detailed Chronology of the November Market Correction
The downward spiral did not occur in a vacuum; it was the culmination of a week defined by relentless selling pressure across both spot and derivatives markets. The chronology of the sell-off highlights how macroeconomic data releases and institutional capital flight synchronized to undermine market stability.

The pressure began accumulating late last week, underscored by heavy outflows from U.S. spot Bitcoin exchange-traded funds. On Thursday, November 5, and Friday, November 6, institutional products recorded massive withdrawals totaling hundreds of millions of dollars. This momentum of capital flight bled into the new week. By Monday, November 9, spot Bitcoin ETFs shed roughly $201 million, followed by an additional $95 million in net outflows on Tuesday, November 10. This marked the fourth—and eventually fifth—consecutive day of net institutional withdrawals, abruptly closing off a vital liquidity channel that had previously sustained Bitcoin’s push toward record valuations.
Simultaneously, the macroeconomic backdrop darkened mid-week. On Wednesday, November 11, the U.S. Bureau of Labor Statistics published the Consumer Price Index (CPI) data for October. The report revealed a 0.4% month-over-month increase in consumer prices, outpacing the 0.3% rise anticipated by economists. Although cooling slightly from September’s hotter prints, the persistent nature of inflation immediately shifted expectations regarding Federal Reserve monetary policy.
By Thursday, November 12, the compounding effect of macro uncertainty, institutional withdrawal, and over-leveraged positions reached a tipping point. Bitcoin breached the $73,000 floor and cascaded past $72,000 on exchanges like Binance, triggering an instantaneous cascade of liquidations that dominated financial news cycles.
Derivatives Flush: Over $650 Million Wiped Out in Hours
The velocity of Bitcoin’s drop below $72,000 was severely exacerbated by systemic leverage within the cryptocurrency derivatives ecosystem. When prices break established technical supports, automated margin calls force exchanges to liquidate under-collateralized positions, creating a self-reinforcing downward spiral of forced selling.
Market data providers and analytics channels on social platforms highlighted the sheer scale of the fallout. Aggregate statistics over a 24-hour period indicated that total crypto liquidations surged between $650 million and $725 million. Crucially, approximately 79% to 85% of these liquidated positions belonged to long traders—market participants who had aggressively positioned themselves for upward price continuation.
The concentration of liquidations within compressed timeframes illustrated the extreme volatility experienced by traders:
- WatcherGuru reported that Bitcoin’s dip below $72,000 single-handedly triggered more than $125 million in long liquidations in a mere 20-minute window.
- Additional technical assessments noted that a broader crypto long liquidation event reached $222 million within just 30 minutes.
- Wider metrics captured by CoinDesk confirmed that Bitcoin futures liquidations alone approached $200.5 million over a single day, while CoinGlass data pegged total crypto futures liquidations at roughly $725 million.
This aggressive leverage flush effectively cleared out speculative froth from the market. However, it also left open interest significantly depleted, signaling that market participants are currently hesitant to re-enter leveraged long positions amid heightened macroeconomic uncertainty.
Institutional Demand Fades as ETF Outflows Accelerate
Institutional capital, which served as the primary catalyst for the digital asset sector’s maturation throughout the year, has transformed from a tailwind into a headwind. The sudden reversal in spot Bitcoin ETF flows has stripped the market of its most reliable source of organic buying pressure.
Data compiled across multiple reporting agencies shows that U.S. spot Bitcoin ETFs faced a brutal stretch of consecutive outflows. BlackRock’s iShares Bitcoin Trust (IBIT)—typically a bellwether for institutional inflows—bore the brunt of the recent redemptions, accounting for $78 million of the $95 million withdrawn on Tuesday alone. Cumulative withdrawals across major issuers topped $1.4 billion over a five-day observation window, depending on the exact accounting parameters used by fund managers.
Financial analysts point out that the behavior of spot ETF investors heavily mirrors traditional risk-off sentiment seen in equity markets. Notably, the crypto correction coincided with a broader cooling in technology stocks, particularly shares tied to major artificial intelligence and semiconductor firms like Nvidia. Bitcoin’s failure to decouple from macroeconomic risk assets or to capitalize on traditional safe-haven narratives has cast doubt on its immediate trajectory, forcing institutional allocators to re-evaluate portfolio risk parameters.
Macroeconomic Pressures and the Federal Reserve Outlook
The resurgence of macroeconomic anxiety has fundamentally altered the liquidity dynamics of the cryptocurrency ecosystem. The hotter-than-expected October CPI print forced fixed-income and derivatives traders to aggressively reprice the path of U.S. monetary policy.
According to CME FedWatch tool data cited by market analysts, the probability of the Federal Reserve implementing a quarter-point interest rate hike—or maintaining a strictly restrictive stance—at its upcoming December 8–9 meeting spiked to approximately 90% following the inflation release. Higher interest rates inherently strengthen the yield profile of traditional fiat-denominated fixed-income instruments, reducing the relative attractiveness of non-yielding speculative assets like Bitcoin. Furthermore, elevated borrowing costs tighten global liquidity conditions, discouraging institutions and retail traders alike from deploying capital into high-beta markets.

Compounding this macroeconomic squeeze is a noticeable contraction in stablecoin liquidity. Data from analytics platform CryptoQuant highlighted that Tether’s (USDT) market capitalization shrank by $6.6 billion over a 60-day period. Because stablecoins act as the primary dry powder and transactional medium utilized by traders to enter digital asset positions, this systemic reduction in stablecoin supply points to a structural decrease in available purchasing power within the ecosystem. As CryptoQuant succinctly noted in market commentary, stablecoin expansion has historically fueled every major rally of the current cycle, making their ongoing contraction a primary concern for market bulls.
Technical Outlook: Navigating Support at $70,000
From a technical perspective, Bitcoin’s inability to defend the $72,000 handle has shifted analytical focus squarely toward the psychological $70,000 support level. Market technicians are closely monitoring whether buyers can establish a durable floor at this level or if further capitulation is on the horizon.
Moving average structures further illustrate the severity of the ongoing correction. CryptoQuant data indicates that Bitcoin’s 200-day moving average hovers near $73,200—a crucial structural benchmark that has flipped from baseline support into formidable overhead resistance. Meanwhile, the longer-term 365-day moving average stands near $76,400, underscoring the substantial recovery required for the asset to reclaim its broader macro uptrend.
While brief bounces back into the lower $73,000 range demonstrate that dip-buyers remain active, the structural damage inflicted by sustained ETF outflows, restrictive monetary policy expectations, and the massive leverage wipeout cannot be ignored. A failure to hold the $70,000 threshold could expose Bitcoin to accelerated downside pressure, whereas a sustainable recovery will entirely depend on a resurgence in spot institutional demand, stabilizing macroeconomic indicators, and a renewed influx of stablecoin liquidity into the broader crypto economy.
