
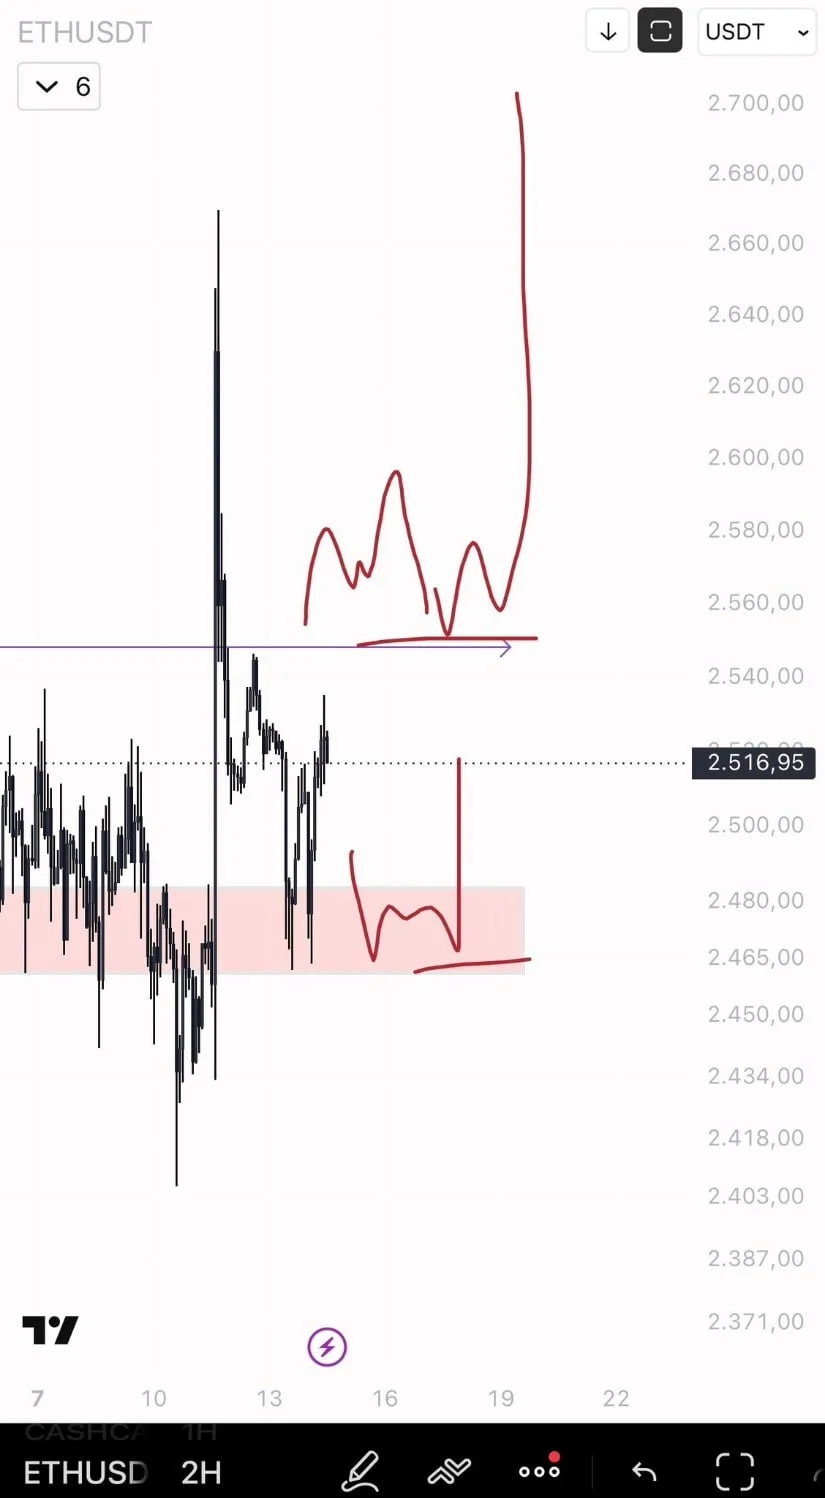
Ethereum (ETH), the world’s leading smart contract platform and second-largest cryptocurrency by market capitalization, is currently defending a critical demand region near $2,450 following a severe wave of market liquidations. Trading around $2,483, the digital asset has experienced a modest 1.47% decline over the past 24 hours according to data from Brave New Coin. The recent price action underscores a period of heightened volatility, defined by failed breakout attempts at higher resistance levels and aggressive short-term positioning by leveraged derivatives traders.
While market participants closely monitor whether buyers can successfully defend the current multi-day trading range, the broader macroeconomic and crypto-asset landscape continues to exert pressure on digital asset valuations. Analysts are evaluating multiple technical indicators, liquidation metrics, and historical price patterns to gauge whether Ethereum can eventually reclaim the pivotal $2,550 threshold and set its sights on higher targets, or if a deeper correction toward historical support zones is imminent.
Main Facts of the Current Market Structure

The primary narrative surrounding Ethereum’s current price action centers on a well-defined short-term trading range. During recent sessions, ETH attempted a bullish push toward the $2,600 psychological level, briefly testing upper boundaries before meeting substantial selling pressure. This rejection pushed the asset back toward its established lower range, placing intense focus on the $2,450 to $2,480 demand zone.
Prominent crypto market chartists, including independent analysts tracked across social intelligence platforms, have noted that previous long positions triggered near the bottom of the range successfully achieved initial take-profit objectives. However, the inability of bulls to sustain momentum above key resistance levels has prevented a broader macro trend reversal.
The $2,550 level remains the most crucial threshold for the higher-timeframe market structure. Ethereum has repeatedly tested this price point but has consistently failed to secure a verified weekly candle close above it. Until bulls can decisively flip $2,550 from resistance into established support, the cryptocurrency remains bound within its current consolidation pattern. A confirmed breakout above this barrier, followed by acceptance above the $2,592 to $2,610 resistance cluster, could pave the way for an extension toward $2,700, $2,800, and eventually the psychological $3,000 milestone. Conversely, a failure to hold the lower boundary risks triggering a deeper downward retracement toward secondary support layers positioned at $2,185 and $1,965.
Chronology of the Recent Volatility and Liquidation Wave

The latest turbulence in the Ethereum market accelerated rapidly during a compressed intraday window, catching numerous leveraged market participants off guard. The chronology of the recent market cycle illustrates how swift price fluctuations can cascade through derivatives exchanges.
In the days preceding the liquidation flush, Ethereum traded in a relatively tight band between $2,500 and $2,600, fostering a buildup of open interest among speculative traders anticipating a bullish continuation. As price action neared the upper boundaries of this range, sellers stepped in aggressively, neutralizing the upward momentum.
This swift rejection triggered a cascading series of automated liquidations across major derivatives platforms. Within a single hour, the broader digital asset market experienced approximately $109 million in total liquidations. Notably, Ethereum accounted for the lion’s share of this financial flush, with roughly $74.05 million in ETH-denominated leveraged positions wiped out. By comparison, Bitcoin recorded a distant second in liquidation volume at approximately $21.6 million, highlighting the concentrated nature of the speculative exposure tied directly to Ethereum’s price swings.
The rapid flush effectively cleansed a portion of the market’s excessive leverage, temporarily resetting funding rates and open interest metrics. Such liquidation events frequently exacerbate short-term price movements as stop-losses and margin calls are automatically executed by exchange algorithms, reinforcing the necessity for traders to seek confirmed structural breakouts rather than reacting to ephemeral intraday spikes.

Detailed Technical Analysis and Indicator Outlook
A granular examination of Ethereum’s lower-timeframe charts provides deeper clarity regarding the boundaries governing the current price consolidation. On the one-hour and thirty-minute timeframes, analysts have mapped out precise levels that dictate immediate market behavior.
Analyst Stefan B’s technical mappings identify immediate downside support at $2,545, anchored by a broader localized demand corridor stretching from $2,440 to $2,460. This specific pocket has repeatedly absorbed selling pressure, making it the primary line of defense for market bulls. On the opposing side, immediate overhead resistance is heavily clustered between $2,580 and $2,592, with an extended barrier residing near $2,610.
Momentum oscillators on short-term charts indicate that selling pressure has reached stretched levels, pointing toward potential exhaustion among bears. The Relative Strength Index (RSI) on the 30-minute chart has dipped to approximately 33, brushing closely against the traditional oversold threshold of 30. While this metric indicates that sellers have driven prices down aggressively in the immediate term, a definitive bullish divergence or recovery signal has yet to materialize.

Simultaneously, the Stochastic oscillator has penetrated deeper into oversold territory, with its primary lines hovering near the lower bounds of 14 to 16. The Moving Average Convergence Divergence (MACD) indicator maintains a bearish reading, characterized by the MACD line sitting beneath the signal line accompanied by a negative histogram. Taken together, these technical indicators suggest that while underlying downward momentum remains active, Ethereum is entering a price territory where a relief bounce or temporary consolidation phase becomes increasingly probable if the $2,450-$2,480 support zone holds firm.
Broader Market Context and Implications
The ongoing struggle between Ethereum buyers and sellers occurs against a backdrop of evolving macroeconomic conditions and shifting institutional sentiment toward digital assets. As global financial markets navigate changing interest rate expectations, inflation data, and regulatory developments, cryptocurrencies continue to exhibit high sensitivity to liquidity flows.
Ethereum’s underperformance relative to historical cycle expectations has been a topic of frequent debate among market observers. While decentralized finance (DeFi) activity, layer-2 scaling adoption, and staking participation rates remain robust foundational pillars for the network, short-term price discovery is heavily influenced by derivatives market positioning and macroeconomic risk appetite.

The heavy concentration of liquidations observed during this recent market cycle demonstrates the inherent risks associated with high leverage in the digital asset space. When speculative positioning becomes overly crowded on one side of the trade, sudden shifts in technical support or resistance can trigger rapid, cascading liquidations that temporarily distort fundamental valuations. Consequently, institutional and retail market participants alike are placing greater emphasis on verified higher-timeframe closes rather than short-term price fluctuations.
Outlook: Navigating the Critical Range
As Ethereum continues to hover around the $2,483 mark, the immediate future of its price trajectory depends on how market participants react to the boundaries of its current range. Maintaining the support zone between $2,450 and $2,480 preserves the integrity of the consolidation pattern and keeps the prospect of another test of the $2,550 resistance alive.
A decisive, volume-backed breakout above $2,550, followed by sustained acceptance past the $2,592–$2,610 resistance band, would invalidate the recent bearish pressure and open the door for a measured recovery toward higher targets at $2,700 and $2,800. Conversely, a decisive breakdown below the lower range support would likely accelerate selling momentum, exposing the asset to deeper technical corrections toward historical demand areas near $2,185 and $1,965. For now, Ethereum remains bound within a tightly contested battleground, awaiting the catalyst that will dictate its next definitive directional trend.
