

Quant (QNT) has successfully reclaimed the psychologically significant $200 price threshold, injecting renewed optimism into the digital asset market following a turbulent and volatile October trading cycle. This recent price recovery coincides with a technical breakout above a falling wedge resistance pattern observed on the 8-hour timeframe, drawing sharp attention from cryptocurrency analysts, traders, and institutional market participants alike. With the token navigating a complex landscape of short-term momentum indicators and formidable overhead resistance barriers, market observers are closely scrutinizing whether this breakout can sustain a broader upward trajectory toward ambitious targets extending beyond the $300 mark.
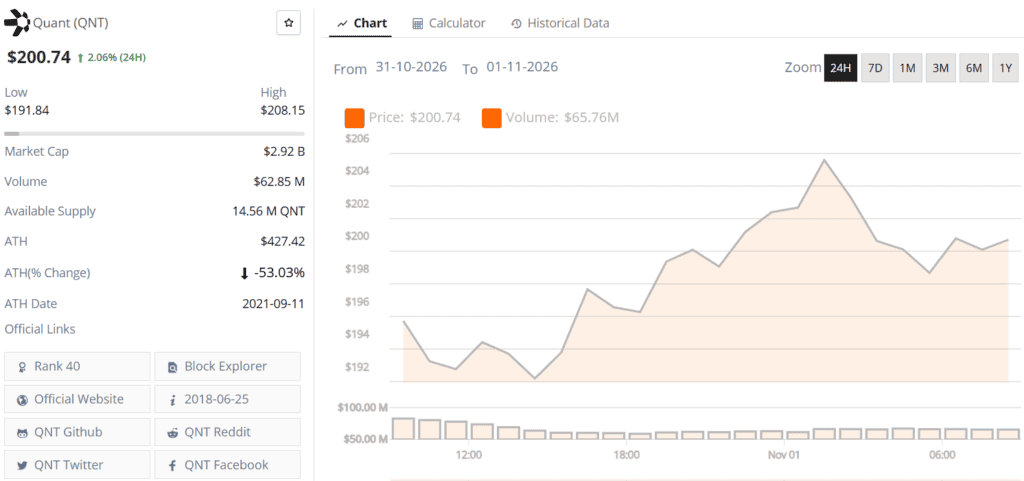
The broader cryptocurrency market has experienced persistent macroeconomic headwinds and localized sector shifts throughout the final quarter of the year. For Quant, October proved to be a period of intense price discovery and consolidation, characterized by wide trading ranges and fluctuating volume metrics. During that month, QNT oscillated heavily between a local low of approximately $175 and a high of $223. Market capitalization metrics during this volatile phase fluctuated between $2.3 billion and $2.9 billion, while daily trading volumes hovered within a moderate band of $57 million to $64 million across various global exchanges.

Despite this choppy price action, the transition into November has brought a measure of technical clarity. On November 1, QNT traded firmly within the $200 to $201 range, having successfully bounced back from a dip toward the $192 support zone. The 24-hour trading window for that session captured a low of $192 and a high of $208, signaling robust market participation and strong buying interest around the newly reclaimed psychological benchmark.
Technical Breakdown of the Falling Wedge Breakout
The foundation of Quant’s current recovery lies in detailed chart patterns identified by prominent technical analysts. According to data shared by market analyst DigitalChartist on TradingView, QNT decisively breached the descending resistance boundary of a well-defined falling wedge on the 8-hour chart. In classical technical analysis, a falling wedge is traditionally viewed as a bullish reversal pattern, occurring when price action contracts within a downward-sloping convergence of trendlines before breaking out to the upside.
Crucially, this breakout was accompanied by a noticeable uptick in trading volume, validating the legitimacy of the move and indicating genuine buying pressure rather than a low-volume fakeout. However, as the price advances, it immediately confronts the Ichimoku cloud—a comprehensive technical indicator used to gauge overall trend direction, dynamic support, and structural resistance. Navigating through the Ichimoku cloud will require sustained momentum, and analysts note that a short-term retest of the broken wedge resistance is entirely plausible. Such a retest would allow the market to establish whether former overhead resistance has successfully transformed into a reliable bedrock of support.
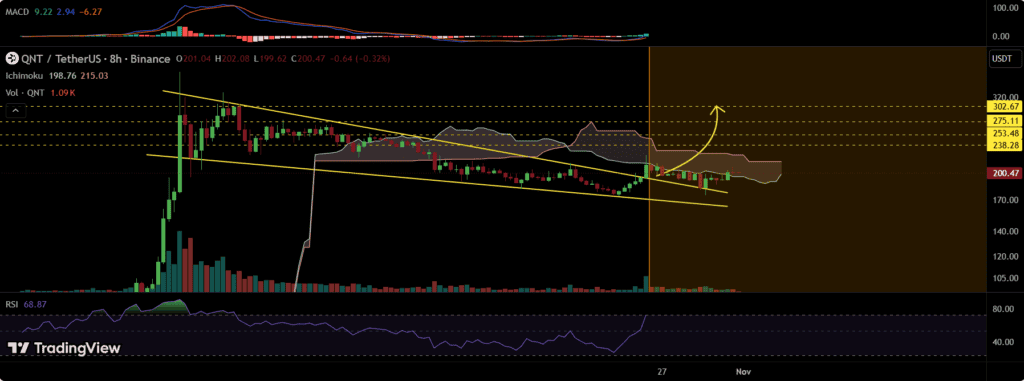
Should the asset successfully clear the Ichimoku cloud following a constructive retest, technical models point toward several progressive upside targets. Conditional price projections identified by market analysts place initial resistance and objective milestones at $238.28, $253.48, and $275.11. If the bullish market structure maintains its integrity over a longer horizon, a more extended rally could eventually bring the much-anticipated $302.67 target into active focus.
Moving Averages and Momentum Oscillators Paint a Nuanced Picture
While intraday and 8-hour charts flash constructive bullish signals, a broader examination of the daily timeframe reveals a more nuanced environment characterized by lingering consolidation. Longer-term moving averages continue to support an intermediate uptrend, demonstrating that the structural foundation established during previous rallies remains largely intact.
Short-term moving averages are tightly clustered, creating a robust defense zone for the asset. The 10-day simple moving average (SMA) rests near $193, while the 10-day exponential moving average (EMA) hovers between $196 and $197. Similarly, both the 20-day SMA and EMA are situated in the $196 to $197 bracket, forming an immediate safety net for the token. Further down the chart, intermediate and long-term indicators reflect the depth of Quant’s historical price movements. The 50-day moving averages are positioned in the $177 to $180 range, while the 100-day averages stretch from $120 to $143, and the 200-day averages sit comfortably between $95 and $114. The substantial distance between current spot prices and these extended averages underscores the considerable magnitude of QNT’s preceding advances.
Momentum oscillators, meanwhile, suggest that the market is currently in a state of equilibrium, awaiting a definitive catalyst to spark the next major trend. The daily Relative Strength Index (RSI) is fluctuating between 49 and 53, placing it squarely in neutral territory. This neutral reading indicates that buying pressure has neither driven the asset into overbought conditions nor allowed bearish momentum to take absolute control.
Similarly, Moving Average Convergence Divergence (MACD) metrics present mixed signals. Recent histogram readings fluctuate near the signal line, showing occasional negative bars that highlight the ongoing need for stronger volume confirmation before a sustained macro-trend can be declared. Bollinger Band analysis adds further context to the current consolidation phase: the middle band aligns with the $196–$197 moving average cluster, the upper band ranges from $212 to $219, and the lower band provides foundational support between $175 and $179. While trading above the middle band is inherently constructive, reaching the upper boundary will necessitate a significant and sustained influx of fresh capital.
Key Support and Resistance Zones for Traders
Navigating the current market environment requires a strict focus on established technical thresholds. For Quant, the $200 level serves as the primary psychological pivot point. Sustaining values above this mark is vital for preserving bullish market sentiment and building the necessary momentum to challenge higher resistance layers.
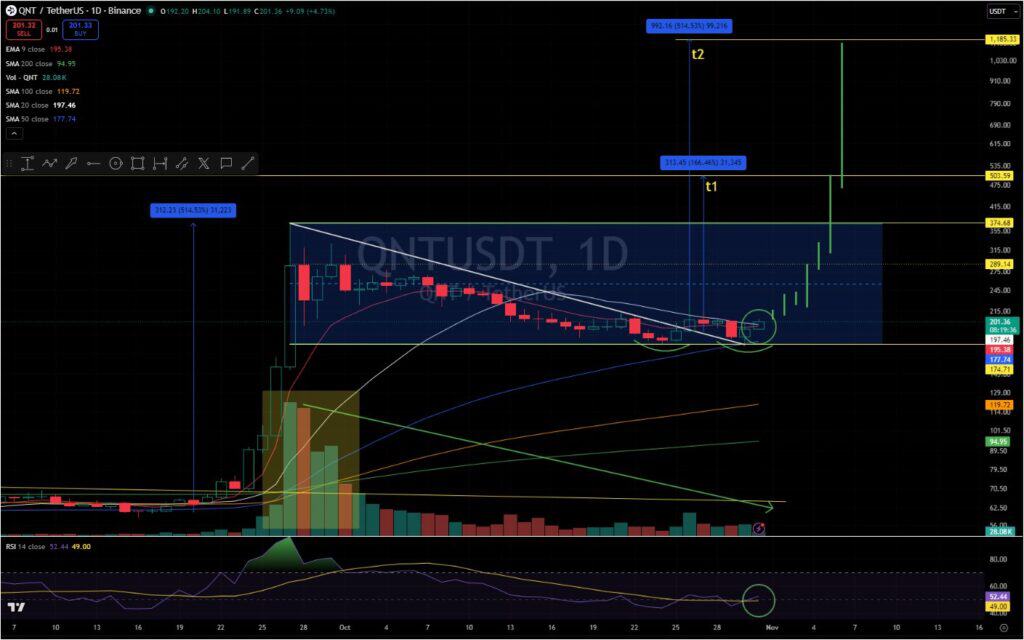
Immediate support is densely concentrated between the $192 and $197 region, a zone reinforced by recent swing lows and the tightly packed short-term moving average cluster. A decisive break beneath this floor could invalidate the immediate recovery thesis and expose lower demand zones. Secondary support is established between $182 and $189, where the 50-day moving averages converge, followed by a deeper and highly resilient demand block at $171 to $176, which corresponds directly with October’s major accumulation phase.
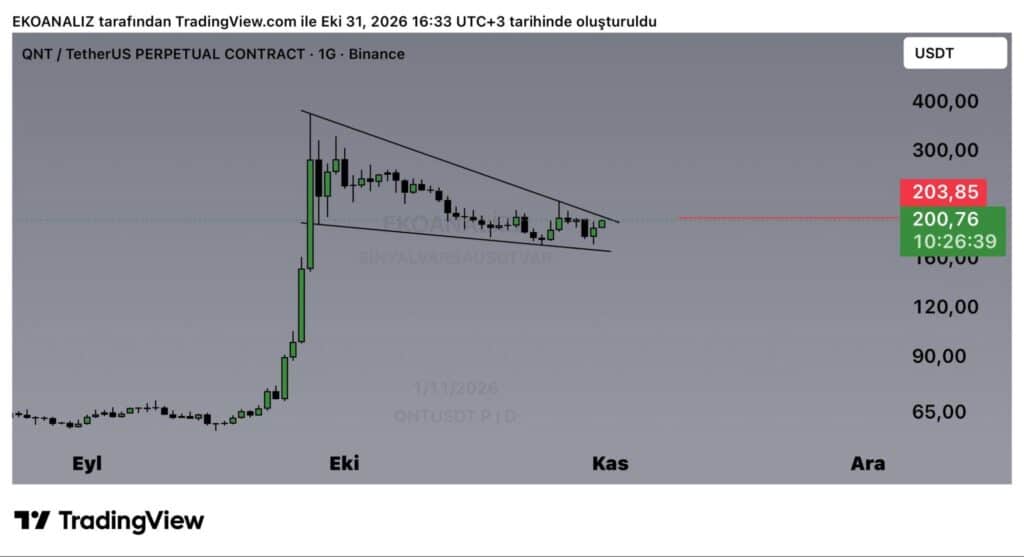
On the upside, immediate friction is observed between $201 and $208. Crypto trader @Ekoanalizz has specifically highlighted $203.85 as a critical threshold on the daily chart, noting that a clean daily close above this level could unlock a rapid wave of buying interest. Beyond this threshold, resistance clusters are identified at $211–$216 and $223–$226 before the higher-timeframe targets mapped out by DigitalChartist come into play. Classic pivot point calculations corroborate these zones, placing immediate resistance near $202 and secondary resistance right below $213.
Alternative technical perspectives shared by community analysts, such as @DrewDog12380, point to additional bullish developments, including a successful test of bull flag support, a double-bottom formation near $175, and a bullish RSI crossover. While some aggressive projections within the trading community stretch as high as $312 or even approach four digits under hyper-bullish macro scenarios, mainstream analysts continue to anchor their expectations to the structured milestones culminating at $302.67.
Token Supply Dynamics and Broader Market Implications
Beyond traditional technical analysis, market participants frequently evaluate Quant’s underlying tokenomics as a contributing factor to its price trajectory. Estimates place the circulating supply of QNT at approximately 14.5 million tokens, with some market commentators referencing an active float closer to 12 million. A relatively restricted circulating supply can act as a powerful catalyst during periods of escalating demand, potentially leading to rapid price appreciation if exchange liquidity remains thin.
However, financial analysts emphasize that supply constraints alone do not guarantee a supply squeeze. Price discovery remains inextricably linked to broader macroeconomic conditions, overall cryptocurrency liquidity, exchange order book depths, and sustained institutional and retail capital inflows. With a market capitalization approaching $2.9 billion, Quant functions as a mid-to-large-cap digital asset that requires meaningful financial backing to drive sustained multi-stage rallies.
As Quant navigates this critical juncture, the interplay between its newly recovered $200 baseline, ongoing technical consolidation, and broader network utility will dictate its short-to-medium-term outlook. Whether QNT can successfully shatter overhead resistance and embark on a definitive march toward the projected $302.67 target depends heavily on the market’s ability to absorb selling pressure, maintain volume expansion, and confirm current breakout structures in the days ahead.
