

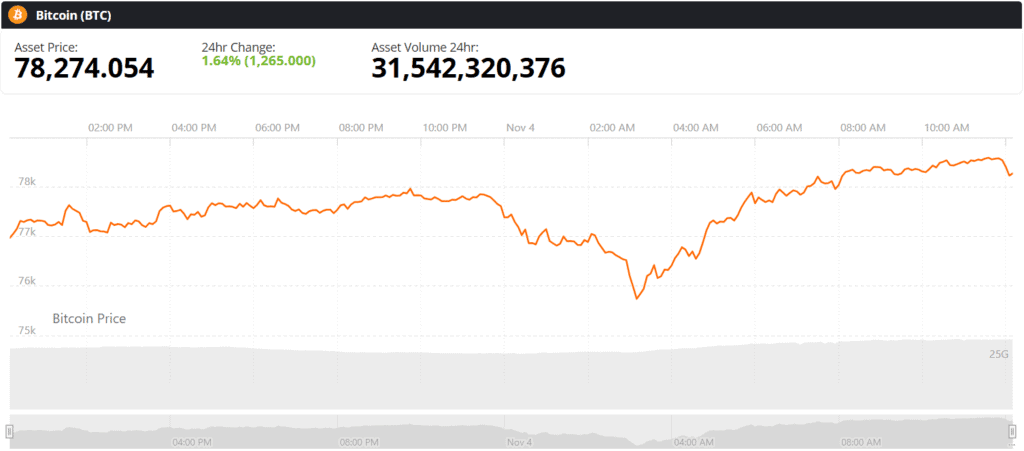
The cryptocurrency market experienced a sharp jolt of volatility on November 4, as Bitcoin staged a resilient recovery back above the $78,000 threshold. This rebound followed an election-night plunge that briefly dragged the world’s leading digital asset below $76,000. The dramatic price swings coincided with early results from the 2026 United States midterm elections, which initially triggered a wave of speculative liquidations across derivatives exchanges. However, aggressive spot market buying quickly absorbed the downward pressure, stabilizing prices and allowing traders to refocus on critical technical thresholds, moving averages, and forthcoming macroeconomic catalysts.
As the political landscape settles, digital asset participants are closely parsing a complex web of technical indicators, on-chain metrics, and institutional capital flows to determine whether this recovery has the legs to retest the psychologically crucial $80,000 barrier.

Main Facts: The Election-Night Volatility and Rapid Recovery
The catalyst for the early-November market turbulence stemmed from the ongoing 2026 U.S. midterm elections. In the days leading up to the vote, Bitcoin had been consolidating near the $78,000 region. However, as initial polling data and preliminary returns suggested a potential Democratic victory in both chambers of Congress, traditional and digital asset markets reacted swiftly. Concerns surrounding potential regulatory headwinds, shifts in fiscal policy, and stricter oversight of the digital asset sector under a Democratic-controlled legislature prompted an immediate wave of risk-off selling.
The downward momentum accelerated aggressively overnight on November 3. On the Bitstamp exchange, the Bitcoin price touched a multi-week low of approximately $75,618, marking its weakest valuation in nearly seven weeks. Yet, the anticipated prolonged bleed failed to materialize. Dip buyers stepped into the market en masse around the $76,000 level, sparking a sharp technical bounce. By Wednesday, November 4, Bitcoin had recovered to roughly $78,354, pulling the broader cryptocurrency ecosystem—including Ethereum and major altcoins—higher in a synchronized relief rally.
Market structure analysts have pointed out that while the political outcome introduced short-term friction, institutional positioning was already prepared for a split or opposition-controlled outcome. Kelly Ye, head of research at Talos, noted in commentary provided to industry publications that Bitcoin’s post-election trajectory closely mirrored what options markets had largely anticipated beforehand, confirming that the main event had already been priced in by sophisticated traders.
Chronology of Market Events
To fully understand the velocity of Bitcoin’s recent price action, market observers have mapped out a tight chronology of events spanning late October through early November:
- Late October: Bitcoin trades within a stable range, though institutional sentiment shows slight cooling, highlighted by approximately $515 million in net outflows from U.S.-listed spot Bitcoin exchange-traded funds (ETFs) throughout the month.
- November 3 (Election Night): Early midterm election results indicate a strong showing for the Democratic party in Congress. Speculative traders begin dumping risk assets, dragging BTC down from the $78,000 range.
- Late Night November 3 to Early Morning November 4: Selling pressure peaks in futures markets, forcing a liquidation cascade that pushes Bitcoin to an intraday low of $75,618 on Bitstamp—its lowest mark in roughly seven weeks.
- November 4 (Daytime): Spot buyers aggressively step in near the $76,000 floor. Cumulative Volume Delta (CVD) metrics show a stark divergence between heavy spot accumulation and ongoing futures shorting. Bitcoin successfully reclaims its 100-day moving average and breaks back above $78,000, setting its sights on overhead liquidity clusters near $80,000 to $82,000.
Supporting Data: Spot Accumulation Versus Futures Pressures
A deeper examination of order book dynamics during the crash and subsequent recovery reveals a fascinating divergence between spot and derivatives markets. According to data shared by prominent crypto market analyst Ted Pillows, a 15-minute BTC chart on November 4 highlighted a positive spot Cumulative Volume Delta (CVD) of roughly $218 million. Conversely, the futures CVD registered a negative reading of approximately $482 million.
CVD measures the net difference between aggressive buying and selling volume over a specified timeframe. A positive spot CVD demonstrates that market participants are actively placing aggressive buy orders on spot exchanges, indicating genuine underlying demand for the underlying asset. Meanwhile, negative futures CVD reflects persistent shorting and hedging activity among leveraged derivatives traders.
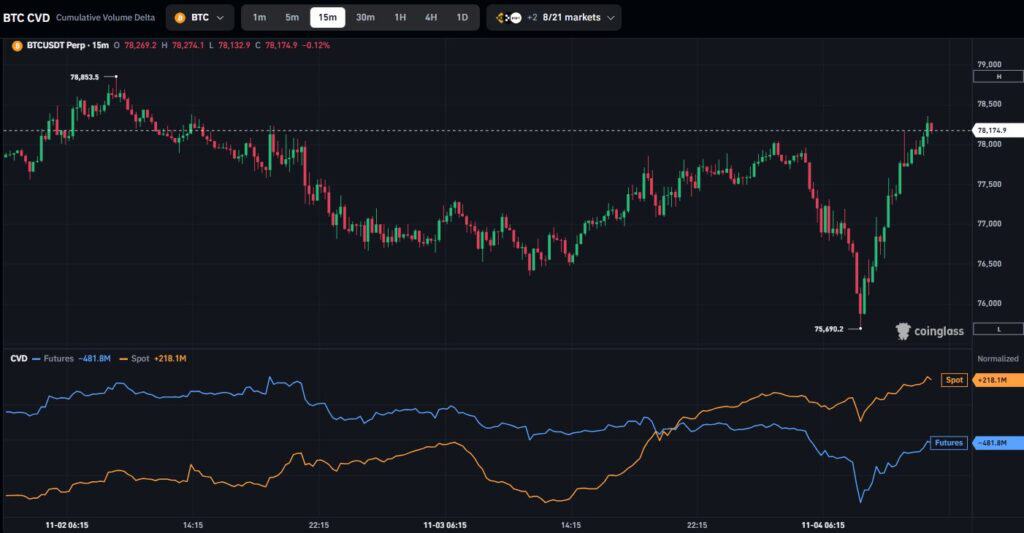
This structural divergence suggests that organic spot buyers utilized the election dip as a strategic accumulation opportunity, effectively absorbing the forced liquidations and short-selling originating from the futures markets. While this dynamic cushioned the downside, analysts caution that sustained upward momentum will require futures traders to flip their bias and join the spot buyers in driving prices higher.
Technical Analysis: Reclaiming Key Moving Averages and On-Chain Metrics
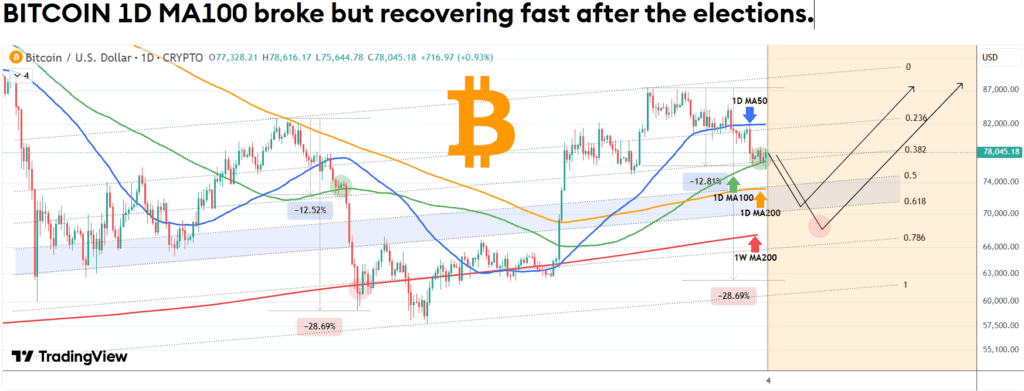
Beyond order book flows, Bitcoin’s broader technical posture has undergone a rigorous stress test. Following the dip below $76,000, Bitcoin briefly breached its daily 100-day moving average (MA)—a closely watched trend indicator it had held since mounting a robust recovery from its previous bear-market lows on August 19.
According to technical breakdowns shared by analysts on TradingView, this brief breakdown mirrored a similar 12.81% retracement observed during a market dip in May. However, the speed of the subsequent recovery back above the 100-day moving average mitigated immediate fears of a protracted macro correction. If the market experiences renewed selling pressure, analysts are closely monitoring the 200-day moving average, as well as the weekly 100-day moving average and the 0.618 Fibonacci retracement level, as formidable zones of structural defense.
On-chain metrics provide further confluence. Data highlighted by CryptoQuant analyst TraderGemini reveals that during the sell-off, Bitcoin traded directly in line with the Trader On-chain Realized Price—an indicator tracking the average acquisition cost basis of coins that last moved between one and three months ago. Holding this critical cost-basis threshold ensures that recent market participants remain generally profitable, dampening the psychological incentive to panic-sell. A failure to hold this level, however, could expose the market to mounting unrealized losses among short-term holders.
Broader Impact, Institutional Sentiment, and Macroeconomic Implications
While technical charts and on-chain indicators provide a roadmap for traders, the macro environment and institutional participation rates remain the ultimate arbiters of Bitcoin’s medium-term trend. The recovery past $78,000 has successfully dampened the immediate panic generated by the midterm election results, but institutional capital inflows tell a more cautious story.
Market reports indicate that U.S.-listed spot Bitcoin ETFs suffered significant capital outflows throughout October, a trend that extended into the first two trading days of November as institutional allocators adopted a wait-and-see approach ahead of the election. This cooling of institutional capital helps explain why Bitcoin has faced stiff resistance near the $80,000 milestone.

Furthermore, liquidation heatmaps from CoinGlass illustrate a massive concentration of leveraged short positions and liquidity clusters clustered tightly between $80,000 and $85,000, with a particularly dense pocket near $82,000. These liquidity pools act as a double-edged sword: they can serve as a magnetic force drawing the spot price upward to trigger short liquidations, but they can also act as formidable walls of overhead resistance.
Markus Thielen, founder of 10x Research, noted in a November 4 market briefing that daily momentum indicators had pushed Bitcoin into oversold territory during the election-night flush, identifying $82,000 as a logical recovery target if broader momentum indicators continue to fire.
Ultimately, while Bitcoin has demonstrated impressive resilience by rapidly reclaiming the $78,000 handle and defending the $76,000 support floor, a confirmed medium-term bullish reversal remains unverified. To shift the market structure firmly back into an aggressive expansion phase, bulls must clear the psychological $80,000 ceiling, neutralize overhead futures resistance, and coax institutional investors back into spot ETF products. Until those milestones are met, Bitcoin is expected to consolidate within a defined range, with market participants watching every macroeconomic headline and order-book shift for the next decisive breakout.
