

The global cryptocurrency market is currently navigating a period of intense macroeconomic headwinds and persistent bearish sentiment, with Ethereum (ETH), the leading smart contract platform, bearing a substantial portion of the downward pressure. While price action points toward a potential retest of crucial psychological and technical support levels—including the $1,500 threshold and more speculative long-term projections pointing toward the $700 zone—an intriguing market dynamic has emerged. Despite the deteriorating price charts, the underlying Ethereum blockchain is experiencing an unprecedented surge in fundamental utility, network participation, and user adoption. This stark divergence between weakening market valuations and surging on-chain metrics has captured the attention of financial analysts, blockchain researchers, and institutional observers worldwide.
Market Context and Recent Price Action
The broader digital asset ecosystem has faced prolonged volatility driven by shifting macroeconomic policies, regulatory scrutiny, and cautious institutional liquidity management. Within this environment, Ethereum has experienced a steady erosion of its short-term price stability. Having previously surrendered several key support boundaries, the asset has tested the $1,600 region, with market participants increasingly bracing for a deeper correction toward the $1,500 mark.
Technical analysts monitoring the macro structures of the asset note that the prevailing bearish trend is characterized by lower highs and sustained selling pressure across centralized derivatives and spot exchanges. However, market observers emphasize that analyzing Ethereum purely through the lens of short-term price fluctuations risks overlooking a profound structural transformation occurring at the protocol layer. While speculative capital retreats from the market, long-term utility and user engagement continue to scale upward, establishing a solid foundation for the network’s future valuation cycles.
Unprecedented On-Chain Growth and Network Activity

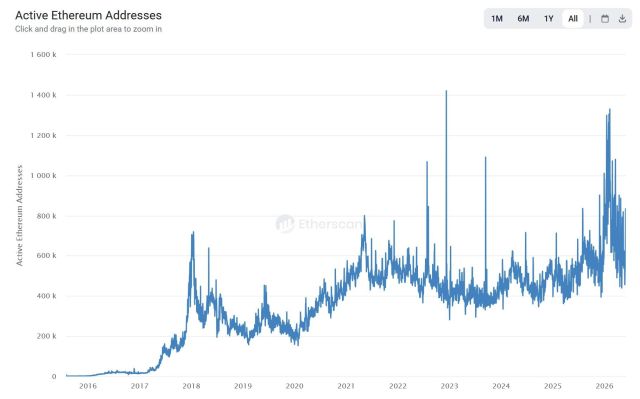
Contrary to historical market cycles where declining prices correlated directly with stagnant or falling network activity, the current market cycle between 2025 and 2026 presents an entirely different paradigm. Data compiled by prominent market researchers, including Leon Waidmann, Head of Research at Lisk, highlights that Ethereum is witnessing a powerful resurgence in network utilization, driving activity metrics to absolute all-time highs.
The blockchain continues to serve as the foundational settlement layer for decentralized finance (DeFi), real-world asset (RWA) tokenization, layer-2 scaling solutions, and an array of decentralized applications (dApps). This multi-faceted utility has sparked a continuous wave of demand from retail participants, independent developers, and institutional entities alike.
A granular examination of historical metrics underscores the sheer scale of this current activity surge. During the 2018 market cycle, daily active wallet addresses on the Ethereum network peaked at approximately 720,000. As the market matured into the historic 2021 bull run, that peak expanded to roughly 800,000 daily active addresses. In stark contrast, during the current 2025-2026 market phase—despite suppressed asset prices—daily active addresses have consistently breached the 1 million threshold, periodically peaking above 1.3 million. This data confirms that the Ethereum network is actively processing significantly more fundamental transactional volume and user engagement today than it did during the height of previous bull market cycles.
Chronology of Exchange Reserves and Supply Dynamics
Compounding the narrative of robust fundamental health is a historic exodus of capital from centralized trading venues. Typically, during periods of heightened market volatility and bearish downward spirals, investors rush to deposit their digital assets onto exchanges to facilitate rapid liquidations, hedging, or panic selling. However, the current cycle has demonstrated the exact inverse behavior.
According to on-chain analytics shared by market experts, the total supply of Ethereum held on centralized cryptocurrency exchanges has plummeted to historic lows. As of recent data tracking, the aggregate exchange balance of ETH stands at approximately 14.5 million tokens. This represents the lowest inventory level recorded in the history of the asset, a milestone traditionally associated with severe accumulation phases rather than pre-crash distribution.

To contextualize this trend, a multi-year timeline reveals a steady and aggressive withdrawal of coins by market participants:
- October 2023: ETH exchange balances experienced a notable local low, holding roughly 21 million tokens.
- 2024 through 2025: A persistent, accelerated outflow of capital from exchanges occurred, driven by accumulation from long-term holders, institutional treasuries, and staking contract deployments.
- Mid-2026: Over the span of approximately two and a half years, more than 6 million ETH have been systematically extracted from centralized exchanges and moved into cold storage, private wallets, or decentralized smart contracts.
Commenting on this unprecedented supply squeeze, market analysts noted that the scale of withdrawals indicates a fundamental shift in investor psychology. Market participants accumulating ETH at these price points are demonstrating a high degree of conviction, opting to remove liquidity from trading books entirely rather than positioning themselves for short-term speculative trading. As Waidmann succinctly summarized regarding the relentless outflow of coins: "Whoever is buying here isn’t selling back."
Analytical Perspectives on Price Bottoms and Valuation Metrics
While on-chain metrics point to robust structural health, technical analysts continue to evaluate historical valuation models to determine where the absolute price bottom of the current correction might manifest. A widely discussed analytical approach involves the utilization of the Ethereum Delta Price metric, a specialized on-chain indicator popularized by seasoned market analysts such as Ali Charts.
The Delta Price metric is calculated by taking the difference between the absolute capitalization of an asset and its moving average capitalization, effectively bridging the gap between investor cost basis and miner production cost. Historically, this specific metric has proven highly reliable in identifying deep accumulation zones and marking the ultimate macro price bottoms for the asset during previous market downturns.
Upon analyzing the current trajectory of the Delta Price model, market analysts have highlighted a theoretical lower-bound target sitting near the $700 region. While a descent to this level would represent a severe corrective phase from current trading prices, analysts emphasize that such historical retests have frequently preceded the formation of major multi-year structural bottoms, eventually giving way to sustained, long-term upward trends. This analytical perspective provides institutional risk managers and long-term investors with a technical framework to measure worst-case scenario valuations against the backdrop of strengthening network fundamentals.
Broader Industry Impact and Implications
The dichotomy between Ethereum’s suppressed price performance and its record-breaking on-chain activity carries significant implications for the broader digital asset landscape.
First, the mass migration of ETH supply away from exchanges into staking protocols, layer-2 ecosystems, and self-custody solutions drastically reduces the liquid circulating supply available for immediate market execution. In economic terms, a declining liquid supply coupled with structurally increasing demand creates a powerful supply-side squeeze. Should macroeconomic conditions stabilize or institutional capital inflows accelerate, the reduced availability of exchange-traded ETH could act as a powerful catalyst for rapid upward price discovery.
Second, the sustained growth in daily active addresses and transactional throughput validates the long-term thesis surrounding utility-driven blockchains. Unlike speculative assets that rely purely on sentiment, Ethereum’s value proposition is increasingly tethered to its role as the settlement layer for global decentralized applications and institutional financial architecture. The fact that developers and users continue to deploy capital and build infrastructure on the network despite unfavorable market conditions underscores the platform’s entrenched network effects.
In summary, Ethereum currently exists in a complex state of market transition. While short-term technical indicators suggest that bearish pressure may persist and potentially test deeper historical support zones, underlying blockchain fundamentals have never been stronger. The combination of record-high active participation, unprecedented structural supply withdrawals from exchanges, and expanding real-world utility paints a picture of an ecosystem maturing rapidly beneath the turbulence of macroeconomic cycles.
