

The traditional mechanics of the cryptocurrency market are undergoing a period of significant re-evaluation as analysts look beyond standard metrics such as Bitcoin dominance and spot ETF inflows to predict the next major market shift. For years, the prevailing wisdom suggested that a surge in altcoins—assets other than Bitcoin—was predicated on a "rotation" of capital where investors took profits from Bitcoin and Ethereum and moved them down the risk curve. However, a burgeoning school of technical thought suggests that the catalyst for the next "altseason" may not originate within the digital asset ecosystem at all, but rather in the price action of gold. This unconventional outlook posits that the precious metal’s next major move will serve as the ultimate signal for whether the next crypto market bounce is a sustainable recovery or a sophisticated "bull trap" designed to flush out retail participants before a genuine rally begins.
The Gold Correlation and the Fibonacci Roadmap
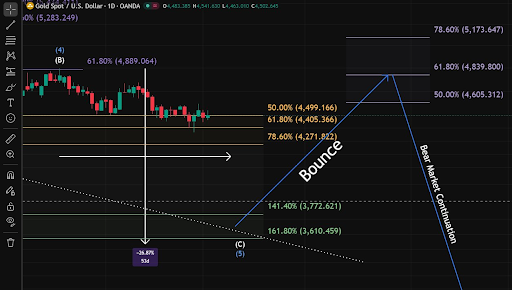
The relationship between gold and digital assets has long been a subject of debate, with Bitcoin often referred to as "digital gold." Currently, gold spot prices are trading near the $4,460 mark, representing a robust 37% increase year-over-year. This growth persists despite a notable correction from the January highs of $5,598. This correction is viewed by market strategists not merely as a localized pullback, but as a broader recalibration of global capital. According to technical projections shared by prominent analysts on the social media platform X, gold is currently positioned for a "bear market rally."
This projected rally aims for the $4,800 zone, a level that aligns with the 61.8% Fibonacci retracement. In technical analysis, this specific retracement level is often a critical "make-or-break" point where an asset either resumes its primary trend or fails and reverses. The thesis suggests that gold will hit this $4,800 target, creating a sense of renewed bullishness across all "hard money" and alternative asset classes. However, the roadmap suggests this is a temporary reprieve. Following the retest of the 61.8% level, gold is expected to resume its downward correction, targeting the 141.4% Fibonacci extension at $3,772, and potentially reaching as deep as the 161.8% extension at $3,610.
The FOMO Mechanism and the Retail Trap
The critical takeaway for cryptocurrency traders lies in the sequence of events triggered by this gold rally. The theory suggests that as gold climbs toward $4,800, a sympathetic and violent rally will ignite across the altcoin sector. This move is expected to be fueled by Fear of Missing Out (FOMO), as retail investors, weary of Bitcoin’s dominance, rush into smaller-cap assets seeking outsized returns.

This FOMO-driven surge is historically a precursor to what analysts describe as a "violent correction." During this phase, the market often experiences a rapid deleveraging event, where sentiment flips from extreme greed to extreme fear. This "capitulation" phase is essential for the health of a long-term bull market, as it transfers assets from "weak hands" (short-term speculators) to "strong hands" (long-term institutional and value investors). The true altcoin season, characterized by sustained growth and fundamental adoption, is predicted to begin only after this final flush of speculative excess has occurred.
Measuring the Crypto Floor: Market Capitalization and Support Levels
While the gold chart provides a macro-timing signal, internal crypto market data shows that the industry is already testing significant long-term floors. The total cryptocurrency market capitalization, excluding stablecoins, is currently hovering around the $2.04 trillion mark. This figure is particularly significant because it is testing a rising support trendline that has its origins in the 2022 bear market bottom and connects through the "reset low" observed in early 2026.
This rising support line represents the baseline growth of the industry’s valuation over a multi-year period. If the market holds this level, it confirms that the structural uptrend remains intact despite short-term volatility. However, the altcoin-specific market (often tracked via the TOTAL2 index, which represents the total crypto market cap excluding Bitcoin) tells a more sobering story. At the time of writing, the altcoin market capitalization has retracted to approximately $882 billion.
Furthermore, the "Altcoin Season Index"—a popular metric used to determine whether Bitcoin or altcoins are outperforming—remains firmly in "Bitcoin Season" territory. This is corroborated by Bitcoin dominance, which currently sits at 57.8%. High Bitcoin dominance typically indicates that the market is in a risk-averse posture, where capital stays in the perceived safety of the largest digital asset rather than venturing into more volatile altcoins.
Chronology of Recent Market Shifts
To understand the current predicament, one must look at the timeline of events leading into 2026.

- Late 2024 – Early 2025: Bitcoin reached new all-time highs following the successful integration of spot ETFs, pulling the rest of the market upward.
- January 2026: Gold reached a peak of $5,598, while the crypto market saw a "blow-off top" in several speculative sectors like AI-tokens and meme coins.
- February – May 2026: A period of "gravitational pull" saw both gold and crypto assets enter a correction phase. Gold dropped toward $4,400, and altcoins lost significant value as Bitcoin dominance climbed.
- Present Day: The market enters a "testing phase" where total market cap sits at $2.04 trillion, and traders are looking for a catalyst—potentially the gold rally to $4,800—to decide the next directional move.
Technical Analysis: The Significance of the "Final Flush"
Market analysts emphasize that a "real" altseason requires more than just a price increase; it requires a shift in market structure. The current decline in altcoin market cap to $882 billion suggests that many projects are currently undervalued relative to their previous highs, yet the lack of a "capitulation event" keeps buyers on the sidelines.
A capitulation event is characterized by:
- High Volume Sell-offs: A massive spike in trading volume accompanying a price drop.
- Sentiment Reset: The "Fear and Greed Index" reaching "Extreme Fear" (typically below 20).
- Stablecoin Inflows: An increase in stablecoin dominance as investors move to the sidelines, creating "dry powder" for the eventual bottom.
The argument for the gold-linked "fake-out" is that it provides the necessary liquidity for one last exit pump before this final flush. If gold reaches $4,800, it provides a psychological "green light" for retail traders to jump back into crypto. When the gold correction toward $3,700 subsequently begins, it could trigger a simultaneous collapse in altcoins, finally providing the "emotional flush" needed to clear the path for a genuine, long-term expansion.
Institutional and Analyst Reactions
While the "gold-to-altcoin" rotation theory is gaining traction among technical analysts on social media, institutional sentiment remains focused on regulatory clarity and liquidity. Analysts from major financial institutions have noted that the correlation between crypto and traditional safe-haven assets like gold has fluctuated wildly over the past three years.
Some argue that the current trend is less about gold specifically and more about "Global Liquidity Cycles." When gold rallies, it often signals that the market expects a weaker dollar or lower interest rates—both of which are highly favorable for risk assets like altcoins. Conversely, if gold’s rally fails at the Fibonacci levels described, it would suggest a "Higher for Longer" interest rate environment, which would be bearish for altcoins.
Broader Implications for Investors
The implications of this analysis suggest a period of heightened volatility and potential deception in the markets. For the average investor, the "gold signal" serves as a warning against chasing green candles during the next rally. If the theory holds true, the next significant upward move in altcoins may be the very trap that precedes the most painful part of the cycle.
The $2.04 trillion support level for the total market cap is the primary "line in the sand" for bulls. As long as the market stays above this rising support, the long-term thesis for crypto remains positive. However, the path to the next altseason appears to be through a "valley of shadow"—a final period of bearish sentiment and capitulation that will likely coincide with gold’s projected descent to the $3,600–$3,700 range.
In summary, the road to the next altcoin season is paved with unconventional indicators. By monitoring the $4,800 gold level and the subsequent reaction at the 61.8% Fibonacci retracement, crypto traders may gain a clearer perspective on whether the market is truly ready for a new bull run or if one final "shakeout" is required to reset the stage for the next decade of digital asset growth. The convergence of gold’s technical correction and crypto’s test of long-term support suggests that the coming months will be a definitive period in the history of the asset class.
