
The cryptocurrency market is currently witnessing a stark divergence between macroeconomic price action and fundamental blockchain health, particularly concerning Ethereum (ETH). While persistent bearish sentiment threatens to drive the asset’s price toward critical support levels at $1,500—with some analysts even warning of a deeper macro bottom near $700—the Ethereum network itself is experiencing an unprecedented surge in adoption and on-chain activity. This paradox has captured the attention of financial analysts, institutional investors, and long-term holders alike, raising fundamental questions about the disconnect between market valuation and utility.
Main Facts: Price Correction Meets On-Chain Vigor
Ethereum, the world’s leading smart contract platform and the backbone of decentralized finance (DeFi), tokenization, and web3 applications, has seen its native token face mounting downward pressure. As macroeconomic uncertainties, tightening liquidity, and broader crypto market corrections take their toll, ETH has struggled to maintain its mid-range stability, repeatedly testing crucial psychological and technical support zones around the $1,600 threshold.
However, beneath this veneer of bearish price action, fundamental metrics tell a radically different story. On-chain data indicates that network utilization is not merely holding steady; it is reaching historic peaks. Rather than following historical precedents where network activity flatlined during extended market slumps, current participation rates demonstrate a resilient, expanding user base that continues to build, transact, and deploy capital across the Ethereum ecosystem.

Chronology and Historical Context of Ethereum Network Growth
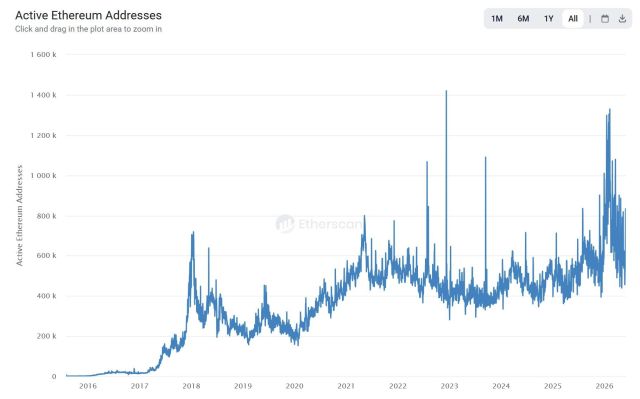
To understand the magnitude of the current on-chain engagement, market researchers have looked back at historical adoption cycles to establish a baseline. During the 2018 cryptocurrency bear market, daily active wallet addresses on the Ethereum network peaked at approximately 720,000. Years later, during the euphoric peak of the 2021 bull market cycle, that metric reached a new high of roughly 800,000 daily active addresses.
Fast forward to the 2025–2026 market cycle, and those historical highs have been thoroughly shattered. According to data shared by Leon Waidmann, Head of Research at Lisk and prominent market analyst, daily active addresses on Ethereum have consistently pushed past the 1 million mark, with periodic spikes peaking above 1.3 million. This structural shift highlights that the network is currently processing significantly higher volumes of genuine, organic activity than it did at the height of previous bull runs, proving that the platform’s utility has decoupled from purely speculative trading cycles.
Supporting Data: Record Low Exchange Balances and Investor Accumulation
Complementing the surge in active addresses is a drastic reduction in exchange-held supply, a phenomenon that traditionally signals strong long-term conviction among holders. Data compiled from prominent blockchain analytics platforms reveals that Ethereum balances on centralized cryptocurrency exchanges have plummeted to historic lows.
As of recent mid-week tallies, the total amount of ETH resting on centralized exchanges dwindled to approximately 14.5 million coins. To put this into perspective, exchange balances sat at roughly 21 million ETH in October 2023. Over the span of roughly two and a half years, more than 6 million ETH have been systematically withdrawn from exchanges into private wallets, cold storage, and staking contracts.

In standard market volatility scenarios, panicked investors typically flood exchanges with their holdings in preparation for liquidations or rapid sell-offs. The ongoing, massive outflow of Ethereum contradicts this historical playbook. As Waidmann succinctly noted regarding the accumulation trend, "Whoever is buying here isn’t selling back." This supply crunch points to a growing cohort of institutional entities, high-net-worth individuals, and dedicated retail investors who view current price levels as an aggressive accumulation window rather than an exit cue.
Analyst Perspectives and Technical Projections: Identifying the Market Bottom
While on-chain metrics point to robust health, traders remain preoccupied with finding the macro price floor. Ali Charts, a widely followed cryptocurrency technical analyst, recently published an evaluation utilizing the Ethereum Delta Price metric to pinpoint where the ultimate cycle bottom might materialize.
The Delta Price metric correlates an investor’s realized cost basis with the actual production cost of network miners. Historically, this indicator has successfully marked the precise bottom of the last two major market cycles by identifying deep, generational accumulation zones. Based on this historical modeling, Ali Charts projected that Ethereum’s absolute bottom boundary could potentially extend down to the $700 region should broader macroeconomic conditions deteriorate further. While a retest of such a low level would represent a steep correction from current trading ranges, analysts emphasize that it would likely represent a maximum bearish overshoot rather than a fundamental failure of the asset.
Broader Impact, Economic Implications, and Outlook
The juxtaposition of plunging exchange reserves, record-high daily active addresses, and a technically vulnerable price chart carries profound implications for the broader digital asset economy.
First, the aggressive withdrawal of ETH from public markets drastically reduces the liquid circulating supply available for immediate trade. In economic terms, a severe reduction in liquid supply coupled with an expanding user base creates a classic supply-and-demand imbalance. Once macroeconomic headwinds dissipate or structural market sentiment shifts, the reduced exchange inventory could act as a powerful catalyst for an explosive upward price revaluation.
Second, the sustained high level of transactional activity reaffirms Ethereum’s status as the foundational settlement layer for decentralized applications. Developers and institutional builders continue to migrate to and expand within the ecosystem, undeterred by short-term price volatility. This sustained developer retention and daily utility insulate Ethereum from purely narrative-driven tokens, reinforcing its valuation as a productive technological asset.
Ultimately, while short-term speculators navigate the uncomfortable reality of potential retests of lower support tiers—ranging from $1,500 down to theoretical macro models near $700—the underlying blockchain data portrays an ecosystem that is structurally stronger, more widely adopted, and more tightly held than at any previous point in its history. Stakeholders and market observers will continue to monitor whether the immense underlying demand can successfully absorb ongoing bearish pressure and establish a durable foundation for the next structural expansion phase.