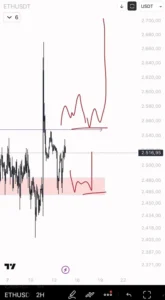
Financial markets have long relied on technical analysis, historical pricing models, and cyclical roadmaps to navigate the notoriously volatile cryptocurrency sector. Among these analytical assets, a previously published Bitcoin roadmap drafted by prominent crypto commentator Klarck in February has recently re-entered public discourse. The renewed interest is not born from a fresh, real-time market update or a newly issued trading signal, but rather from the simple reality that Bitcoin’s recent price trajectory has brought the leading digital asset dangerously close to one of the critical downside zones outlined in Klarck’s original projection months prior.
When the roadmap was initially shared on the social media platform X, its ambitious targets and severe retracement zones generated considerable debate. Technical analysis often relies on multi-stage hypotheses that encompass bullish expansions, corrective contractions, consolidation periods, and eventual macro breakouts. Klarck’s thesis was no exception, charting a complex path that envisioned an initial local relief bounce toward the $83,000 threshold, followed by a deeper, more punishing market correction pulling the asset down into the $65,000 to $55,000 range. Beyond this correction, the roadmap anticipated a sustained two-week accumulation phase designed to wash out leveraged positions, eventually laying the foundation for a massive structural recovery toward an ultimate cycle target of $140,000 per Bitcoin.
As market conditions evolve and price action begins to mirror the preliminary downward stages of this speculative trajectory, traders, analysts, and retail participants alike are dusting off the old chart. This phenomenon highlights a broader psychological trend within financial markets: when price action validates even a portion of an older forecast, market participants routinely revisit the source material to gauge whether the subsequent steps of the thesis might also hold true. However, financial analysts emphasize a crucial distinction between market validation and absolute prediction. The fact that Bitcoin has descended toward the upper boundaries of the predicted corrective zone does not inherently validate the accuracy of the entire roadmap, nor does it guarantee that the asset will successfully bounce, accumulate, or ultimately surge toward the lofty $140,000 milestone.
Chronology and Evolution of the Forecast
To understand why this specific roadmap is regaining traction, it is necessary to examine the chronological sequence of events surrounding its publication and the subsequent behavior of the cryptocurrency market. In the weeks following the initial February post, Bitcoin experienced the fluid, high-velocity price swings that have historically characterized its market cycles. At the time of the post, prevailing market sentiment was deeply intertwined with macroeconomic factors, shifting regulatory landscapes, and fluctuating institutional inflows via spot exchange-traded funds (ETFs).
Klarck’s projection did not immediately capture mainstream attention because it flew in the face of prevailing short-term euphoria. While many commentators were hyper-focused on immediate all-time-high breakouts, the roadmap mapped out a methodical, painful corrective phase. It argued that a direct, uninhibited march upward was statistically improbable without a significant cleansing of market leverage. The first phase—the anticipated relief bounce toward $83,000—acted as an initial testing ground for bullish momentum. Once that local peak was established, the market began to carve out the gradual downward slope envisioned in the analysis.
Months later, as broader macroeconomic headwinds, liquidity contractions, and shifting derivatives markets exerted downward pressure on digital assets, Bitcoin began trading closer to the upper parameters of the $65,000 to $55,000 downside zone. This convergence of price and projection transformed an overlooked historical social media post into a focal point for technical traders seeking contextual reference points. Rather than treating the roadmap as a crystal ball, seasoned market participants are utilizing it as an intellectual framework to observe how current support and resistance levels interact with previously mapped liquidity pockets.
Deconstructing the Critical $65,000 to $55,000 Support Band
At the core of the revived discussion is the identified price band ranging from $65,000 down to $55,000. When Bitcoin is trading significantly higher than a projected corrective floor, forecasts pointing toward steep double-digit percentage drops are frequently dismissed by bullish market participants as fear-mongering or overly pessimistic technical maneuvering. Yet, as price action systematically erodes previous gains and inches closer to those once-dismissed thresholds, the psychological weight of the zone increases exponentially.
Within technical analysis, a zone of this magnitude is rarely a razor-thin line on a chart; rather, it represents a dense cluster of liquidity, historical volume nodes, and institutional cost bases. If Bitcoin establishes a firm foothold and stabilizes within the upper limits of this bracket, it could signal the beginning of the accumulation phase outlined in the February roadmap. An authentic accumulation phase typically requires specific structural behaviors from the market: the cessation of lower lows, the tightening of daily volatility ranges, and a noticeable decrease in aggressive selling pressure from leveraged market participants.
Conversely, if the upper boundary of this crucial zone fails to hold, the market dynamic shifts dramatically. Traders and algorithmic execution models will immediately turn their attention to the lower end of the range, eyeing the $55,000 threshold as the primary liquidity target. Breaching that floor could trigger cascading liquidations across major derivatives exchanges, forcing a comprehensive reset of market sentiment and washing out remaining speculative excess before any genuine macro trend reversal can take place.

The Inherent Risks of Relying on Historical Forecasts
While technical roadmaps provide structured frameworks for navigating uncertainty, financial experts continuously issue warnings regarding the dangers of anchoring investment decisions to legacy forecasts. Financial markets are dynamic, highly fluid ecosystems influenced by a constantly shifting matrix of macroeconomic variables, geopolitical events, monetary policy decisions by central banks, and sudden changes in global liquidity.
A forecast that appeared structurally sound in February may completely lose its validity by the time the asset actually reaches the projected price levels, simply because the underlying economic plumbing of the market has transformed. Global interest rates, inflation prints, treasury yields, and regulatory announcements can fundamentally alter institutional appetite for risk assets within a matter of days. Consequently, utilizing an older roadmap as a rigid trading plan is widely regarded by professional risk managers as a hazardous strategy.
Instead, market veterans advocate for a methodology that treats historical roadmaps strictly as observational reference points. By recognizing where historical technical analysis aligns with current order books and price action, traders can better contextualize the severity of ongoing market tests. However, every directional thesis must ultimately pass the test of real-time market confirmation. Relying on an outdated social media post without continuously verifying order flow, volume profiles, and macroeconomic health exposes market participants to unnecessary financial risk.
Broader Market Implications and Macroeconomic Context
The resurgence of interest in Klarck’s Bitcoin roadmap occurs against a broader backdrop of macroeconomic maturation within the digital asset class. As Bitcoin becomes increasingly integrated into traditional financial portfolios, corporate balance sheets, and regulated exchange-traded products, its sensitivity to macroeconomic liquidity cycles has intensified. Gone are the days when retail sentiment alone dictated the cyclical rhythm of the cryptocurrency market. Today, Bitcoin interacts directly with global liquidity indexes, treasury bond yields, and institutional hedging strategies.
This institutionalization means that major price corrections—such as the descent toward the $65,000–$55,000 band—are no longer driven solely by speculative retail fear. They are frequently the result of systematic risk-off positioning by macro funds adjusting their exposure in response to global economic data. When a technical roadmap accurately anticipates the arrival of price at a major historical support zone, it often speaks less to prophetic vision and more to the recurring behavioral patterns of human psychology and algorithmic trading models operating within predictable market structures.
Furthermore, the psychological impact of these zones cannot be overstated. Retail investors watching a popular asset retrace toward lower thresholds often experience heightened anxiety, leading to panic selling at the exact moments when institutional smart money is quietly engaging in accumulation. If the roadmap’s prediction of an eventual transition from accumulation back into macro growth plays out, it will likely be preceded by a period of profound market boredom, sideways consolidation, and widespread despondency among short-term speculators.
Conclusion and Future Outlook
Ultimately, the renewed attention surrounding Klarck’s February Bitcoin roadmap serves as a fascinating case study in market psychology and technical analysis longevity. The fact that Bitcoin has drifted downward into the vicinity of the predicted downside zone has successfully thrust the old projection back into the spotlight, sparking lively debates across digital asset forums and trading desks.
Yet, the overarching lesson for the broader investment community remains one of disciplined caution. While technical roadmaps help map out hypothetical futures and provide conceptual boundaries for risk management, they are not guarantees of future price performance. The $65,000 to $55,000 range stands as an undeniable proving ground for the current market cycle. Whether Bitcoin uses this zone as a launching pad for a renewed structural advance toward the ambitious $140,000 target or succumbs to deeper macroeconomic pressures will depend entirely on real-time market validation, ongoing liquidity dynamics, and incoming macroeconomic data. Until definitive confirmation emerges from current price action, traders and analysts alike would be wise to respect the map without blindly following its every turn.