Ethereum continues to navigate a challenging macroeconomic and technical landscape, languishing below the $1,700 threshold as market apathy and pervasive uncertainty keep participants on the sidelines. While the broader cryptocurrency market searches for a definitive bottom following a steep multi-month correction, on-chain metrics reveal a fascinating divergence in network behavior. Analysts point out that while everyday retail activity has sharply contracted, larger institutional entities and high-net-worth investors—commonly referred to as whales—are quietly consolidating their positions. This dynamic paints a picture of a tightening market float, even as price charts reflect persistent bearish momentum.
Main Facts and Current Market Structure
The second-largest cryptocurrency by market capitalization has been trading under heavy bearish control on daily timeframes, hovering near the $1,630 mark. This follows a brutal breakdown from a multi-month consolidation range that had previously defined price action earlier in the year. The loss of the crucial $1,800-to-$1,900 support zone served as a major catalyst for accelerated selling pressure, ultimately dragging Ether down to fresh annual lows near the $1,500 region.
From a structural standpoint, Ethereum’s series of lower highs and lower lows remains intact. The recovery efforts witnessed earlier in the year peaked near $2,400 before sellers aggressively regained command of the order books. Furthermore, the asset’s price is currently situated well below its major moving averages, including the 50-day, 100-day, and 200-day simple moving averages across multiple timeframes.

Despite this grim technical outlook, specialized network intelligence data compiled by platforms like CryptoQuant tells a nuanced story. On-chain metrics highlight a stark behavioral split between retail users and large-scale holders, suggesting that the current price weakness may not be indicative of fundamental network decay, but rather a classic period of accumulation by sophisticated capital.
Chronology of the 2026 Downtrend
To understand Ethereum’s current predicament, it is essential to trace the chronology of market events that shaped the asset’s trajectory throughout the year:
- Early First Quarter: Ethereum established a prolonged consolidation range between $1,800 and $2,400, acting as a period of equilibrium where buyers and sellers repeatedly tested institutional demand zones.
- April to May Recovery Window: A brief bullish wave pushed prices toward local highs near $2,400. However, this rally failed to establish a higher high, creating a localized technical ceiling that ultimately favored the bears.
- Late May Breakdown: The crucial $1,800-to-$1,900 support floor, which had successfully absorbed downward pressure for months, decisively gave way under mounting macroeconomic headwinds and waning speculative interest.
- June Sell-Off and Volume Spikes: The loss of support triggered a cascading wave of liquidations, generating some of the highest trading volume spikes seen in months. Prices plunged toward a local floor near $1,500, where buyers finally stepped in to mount a temporary defense.
- Present Day: ETH stabilizes below $1,700, with market participants closely monitoring the $1,500-to-$1,550 zone as the primary battleground for a potential macro base-building phase.
On-Chain Data and the Whale-Retail Divergence
A deeper dive into on-chain analytics reveals why seasoned market observers are paying close attention to current blockchain telemetry. According to data highlighted by analyst CryptoOnchain, daily transactions originating from regular retail wallets have plummeted by approximately 43% over the past week. Taken in isolation, such a steep decline in transaction counts would typically signal a network losing active users and fading into irrelevance.
However, this metric directly opposes another critical on-chain indicator: the average value transferred per transaction. Over the same timeframe, the average transfer size has surged by more than 184%, with the median transfer size exhibiting an even more dramatic upward trajectory.

This statistical divergence—fewer overall transactions, but significantly larger capital movements—is a well-documented phenomenon during historical periods of market stress. Retail participants, driven by uncertainty and apathy, tend to step aside and halt routine interactions with the blockchain. Conversely, high-net-worth investors and institutional players seize the opportunity to execute deliberate, high-value accumulation strategies. Rather than indicating a dying network, the data reflects a consolidation of capital into fewer, stronger hands.
Exchange Flows and Liquidity Dynamics
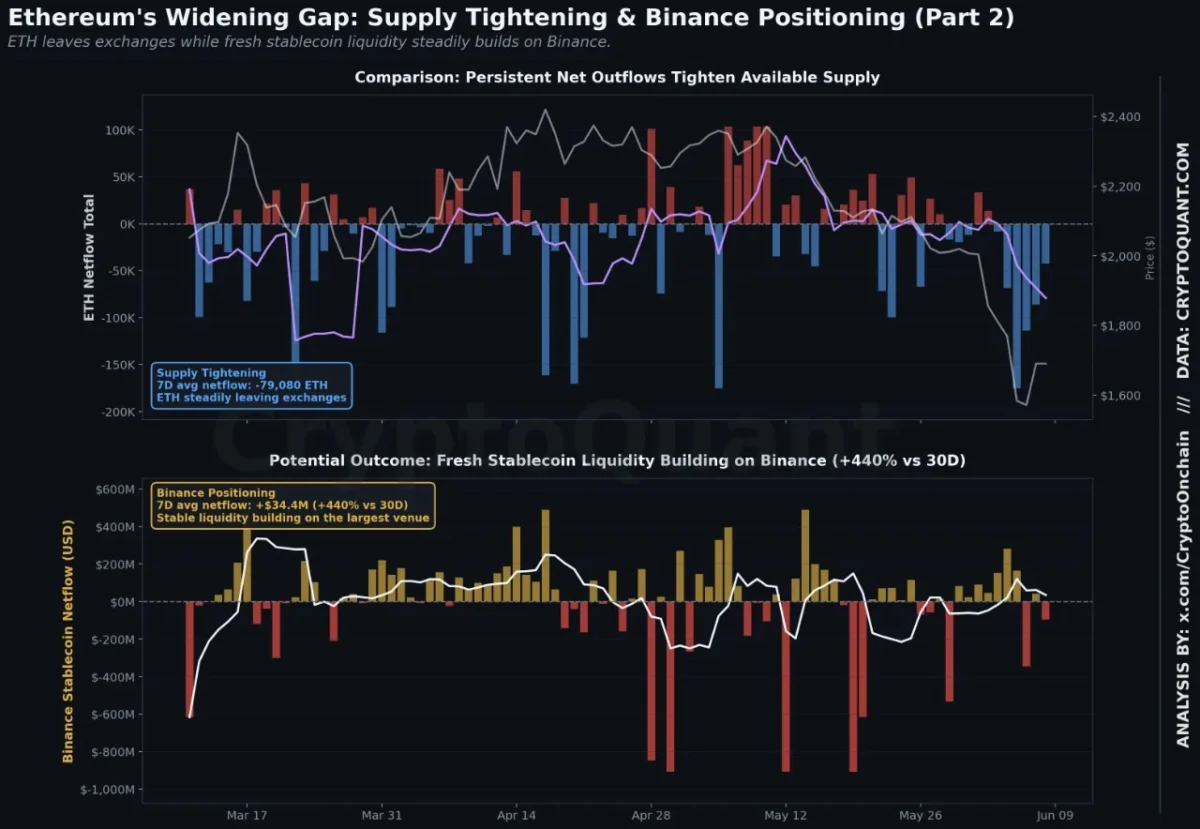
Supporting the on-chain accumulation thesis is a closer examination of exchange netflows and stablecoin reserves. Ethereum netflows remain deeply negative, sitting at approximately -79,080 ETH. This indicates a consistent, ongoing withdrawal of spot tokens away from centralized trading platforms and into cold storage or decentralized finance (DeFi) protocols, effectively removing immediate selling pressure from the active order books.
Concurrently, fresh capital has begun arriving on major derivatives and spot exchanges, particularly through stablecoin channels. Stablecoin netflows into Binance have spiked to a strongly positive +$34.4 million, representing a staggering 440% increase compared to the 30-day average. This influx of sidelined liquidity arrives precisely as spot ETH is being drained from exchange reserves.
Derivatives data corroborates this institutional positioning. Open interest on Binance has expanded by roughly 9% over the quarter, signaling that larger market participants are quietly building leveraged exposure alongside their spot accumulation. This dual movement—tightening spot supply combined with parked buying power—creates a classic structural setup where the available market float shrinks while potential purchasing power accumulates on the sidelines.

Technical Analysis and Key Price Levels
From a technical perspective, Ethereum’s immediate path forward depends heavily on how price action behaves around key historical levels. The breakdown below $1,800 has turned former support into formidable resistance. Unless buyers can orchestrate a sustained volume-backed move to reclaim the $1,800-to-$1,900 band, technical analysts warn that any short-term rallies will likely be categorized as corrective bounces within a broader, multi-month downtrend.
The immediate line in the sand is the $1,500-to-$1,550 region. Having survived the initial shock of the June sell-off, this zone represents the most critical demand cluster of the year. A successful defense of this area could provide the foundation necessary to build a durable base, following a brutal 35% retracement from May highs. Conversely, a failure to hold this psychological and technical floor could invite an extended retest of lower historical liquidity pockets.
Broader Impact and Market Implications
The broader implications of this current market structure extend far beyond short-term price fluctuations. Historically, prolonged periods of retail apathy coupled with aggressive whale accumulation have served as the precursor to significant medium-to-long-term trend reversals. While structural setups do not guarantee an immediate bullish breakout—as they require macroeconomic or fundamental catalysts to activate—they heavily influence market asymmetry.
By removing liquid supply from exchanges while simultaneously building dry powder via stablecoin reserves, large institutional players are positioning themselves to capture disproportionate upside when market sentiment eventually shifts. For the broader digital asset ecosystem, Ethereum’s current phase underscores the ongoing maturation of its investor base, where macro uncertainty shakes out short-term retail speculation while cementing the asset’s footprint among deep-pocketed long-term allocators. As the market searches for a definitive macro bottom, all eyes remain locked on whether the developing supply squeeze will find the catalyst it needs to trigger a broader recovery.